Slemma is a customizable data visualization solution designed for multiple data sets. It replaces the rigid requirements of preset reporting charts in other platforms. With this, you can make customized reports and dashboards. The software product makes creating simplified and color-coded charts about metrics you deem pertinent a hassle-free affair. With a dynamic interface and adaptability to different metric analyses, Slemma gives you more control over your reports.
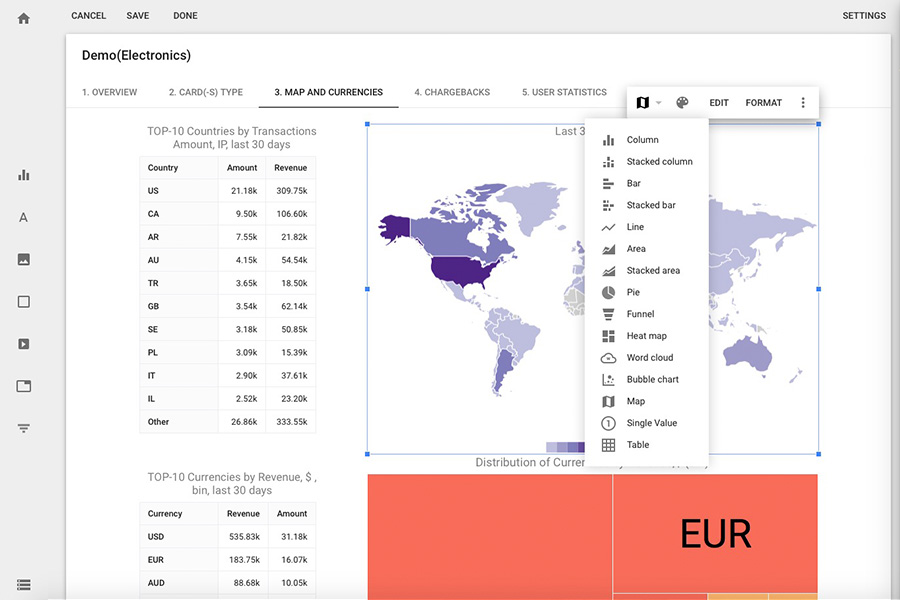
Slemma’s key benefit is that it gives you fully customizable templates for reporting charts. You can choose different visual components such as pie charts, graphical lines, 3D visuals, and cumulative bars. The system also lets you personalize your dashboard. Different color schemes and logos can be added to infuse each report with company brand aesthetics. The dashboards generated can also be integrated with several data warehouses and third-party analysis software solutions.
Slemma Features
Dashboard Templates
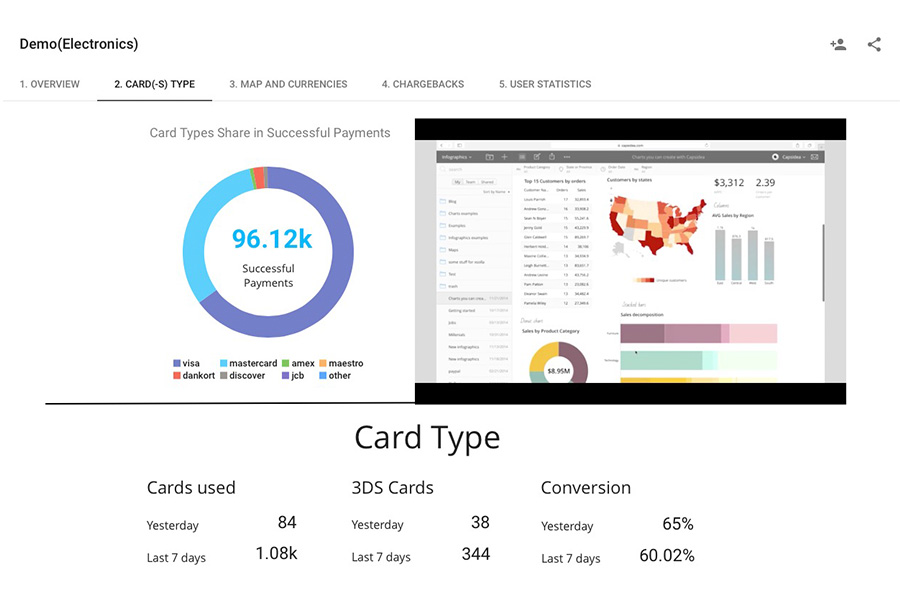
When opening Slemma, the dashboard shows you a bevy of statistics including views on the site, the number of visitors per country, and age demographics. As has been mentioned, you can personalize the dashboard to include your logos and color scheme.
Different dashboard types can be pre-built based on other software solutions. This includes Google Analytics, Zendesk, and QuickBooks. Alternatively, you can build a dashboard from scratch.
There are two ways your clients can share data on your websites. The first way is achieved by embedding the branded Slemma dashboards onto your site. This lets your clients use it there instantly. Alternatively, you can build white label designs with unique URLs.

Fully Customizable Reports
Aside from dashboards, you can also create and edit reports. Unlike other systems that rely on pre-set templates, Slemma lets you build your own from scratch.
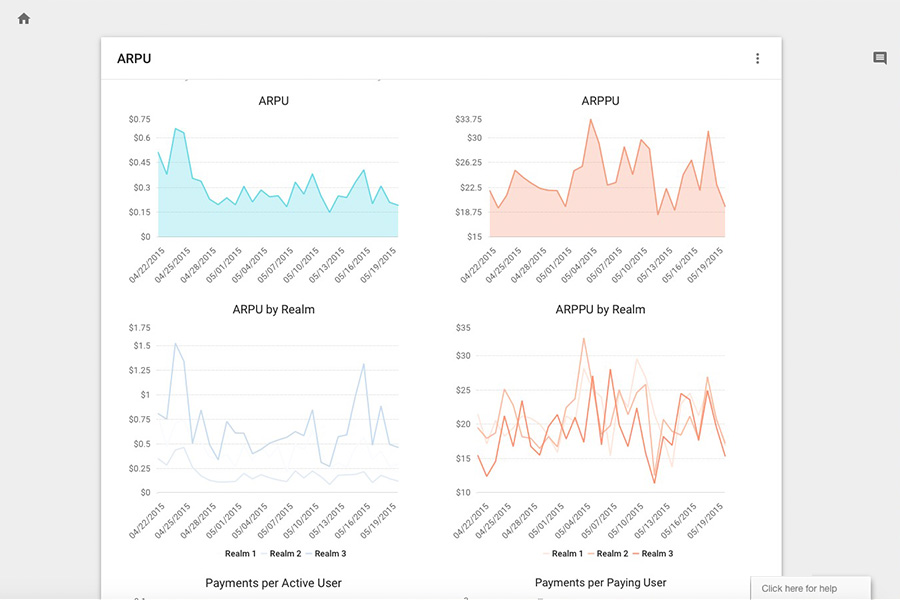
Each new template you build or modify can fit any data sheet. Several different chart types can be used to give you easy-to-read visuals. All of them can be color-coded to distinguish the sources of data. As has been mentioned, you can choose from a bevy of visual components such as pie charts, accumulated bar graphs, and geographical hotspots.
When building them, you can use the Slemma Wizard tool to guide you on how to make each report. Different data sources can be selected such as your audience or sales. You can then select the filters you want like revenue per visit or purchase. Once you finish selecting and organizing your metrics, you can also personalize the report with company brand aesthetics.
Each report updates in real time and can show different results for daily, weekly, or monthly intervals. When handling different report types, you can choose between white label or pre-built downloadables. Like the dashboard, you can provide these for your clients for them to use for their own data.

Security Measures
Recognizing that reporting data requires topnotch security, Slemma has several security features in place. It uses user-based access, storage, and regular security scans to protect your business.
For cloud-based computation, the platform uses the Amazon Web Services (AWS) platform. AWS has several policies for managing data and firewalls to keep viruses and other malware out. Slemma helps with several data encryption protocols to secure your information. This includes a Transport Layer Security (TLS) module to make it resistant to hackers.
When logging in with your account, the solution requires a username ID-and-password combination. If your account encounters several failed logins, it is locked down.
Several user access levels exist to provide roles and permissions for those who use your site. You can enable their ability to create, edit, or share company-sensitive data. Admin rights also let you create and delete users and their billing information.
Third-Party Integration
Slemma can integrate with several external software platforms/products, allowing you to use the software solution for social media, customer relationships, eCommerce, and database reporting.
For social media, you can view interactivity between the company account and the customers. Third-party social media platforms here include Twitter, Instagram, and Facebook.
For customer relationship, integration with third-party software solutions allows you to easily see fluctuations in your sales. You can check your product pipelines to find discrepancies or issues. You can also use it to see if new methods improve your sales flow. However, it cannot be used to predict data. Integrations here include Pipedrive, Salesforce, and Insightly.
For eCommerce, you can use this to view ROIs and bottom-line numbers. This can help you assess trends where customer behavior is concerned. You can also use it to check individual customer profiles. Integrations here include Magento and Shopify.
For databases, the software solution allows IT personnel overseeing data repositories to generate dynamic reports by coding SQL queries. You can use Slemma to connect to a Secure Socket Layer (SSL) tunnel for better security and information. Integrations here include Amazon Redshift, MySQL, and Oracle.

Slemma Benefits
Slemma stands out from other software thanks to its emphasis on building unique reporting templates. It recognizes the limits of pre-set templates in other platforms. With the option to build your own charts and data sources, you can make contextually useful dashboards.
Another highlight of the solution is its topnotch security system. To prevent a security breach, several measures such as annual scans and role-based access are available. The solution can be kept either through a cloud-hosted site or installed on-premise.
There is also the different template sharing capabilities. You can choose between downloading templates from other users and building your own.
Slemma Pricing
The solution has a 14-day demo. There are four different plans, each with a corresponding monthly subscription fee, as well as the option for annual subscriptions. You can also choose between having a cloud-hosted account or an on-premise account. For this review, only monthly subscriptions are considered.
The first plan is called “Basic” and costs $29 per month. Note that this version only uses manual refreshing. It’s also limited to three users at a time. This is recommended for startup companies and businesses on a tight budget. The features included here are:
- Manual refreshing – You can only update reports upon clicking.
- Local files and uploads
- Customizable dashboard
- PDF download
- Email support
The second plan is called “Small Business” and costs $99 per month. This has additional features for customizable templates and client directories. It has a user limit of 10. Several features are added on top of what’s in the Basic plan. These are:
- Daily refreshing – Reports now update at the start or end of each day.
- Chat support
- Database integration – Export your own data for visualization.
- Client directories
- Delivery – Send raw data to your clients or other personnel.
- Dynamic filtering
- Template designer
The third plan is called “Standard” and costs $199 per month. This has additional features for assistance in customization and expanded branding. It has a user limit of 30. All previous features are included. Added on top of these are the following:
- Presentations – Show several reports simultaneously.
- Onboarding assistance
- Branding
- Embedding – Add links from Slemma’s reporting site to your company page.
The fourth and final pricing plan is called “Client Reporting” and costs $599 per month. It has a greatly expanded user limit of 80. This is recommended for businesses wanting to provide full datasheet access to clients. The following features are added on top of the ones included in the previous plans:
- White label – You can now remove the Slemma brand
- Client group admin – Ddd your clients into one group account that has exclusive access to reports.
Conclusion
Slemma is a customizable data visualization solution designed for multiple data sets. It stands out thanks to an in-depth data sharing and advanced security measures. It isn’t constrained by requirements of rigid pre-set reports on other systems. However, it cannot make data forecasts. This is recommended if your company wants functional and contextual reporting at relatively cost-effective price points.


