Infogram is an intuitive data visualization tool. It helps users in a variety of ways—saving hours on creating content, staying on brand, delighting audiences with interactive content and collaborating with team members. It’s suitable for marketers, media companies and strategic business leaders who want to create data-driven content.
Infogram Features
Infogram is complete with powerful features that are catered for easy customization and interactive designs. Not only are you equipped to create advanced visuals, but you can also track the performance of your work based on metrics and tracking links. This allows you to focus on pushing out responsive content for your audience to see.
The top features of Infogram are highlighted in the following:
Charts, graphs and maps
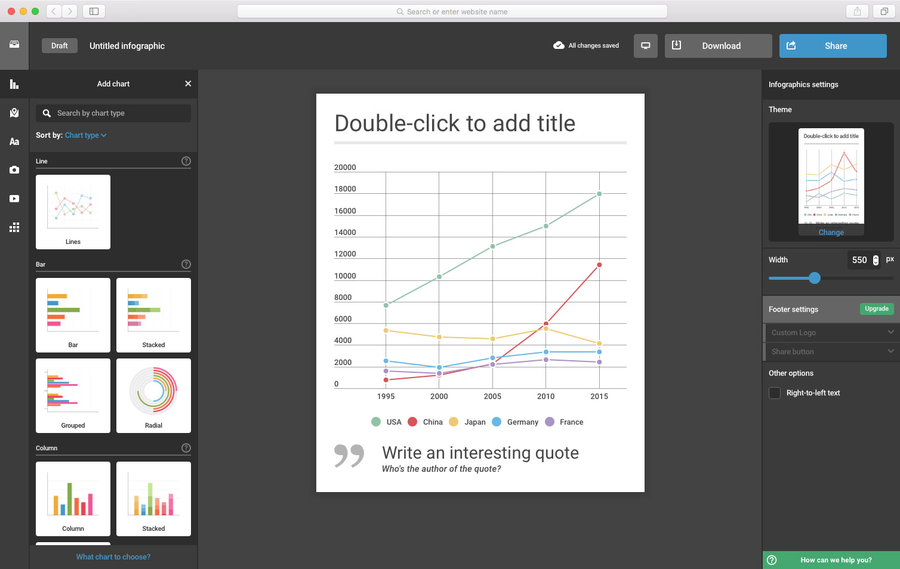
Users are given a variety of charts, graphs, maps and other known designs to improve the visuals of their data. This includes having access to more than 35 interactive charts and over 550 map designs. Some of these graphic representations include pie charts, bar graphs, column tables, word clouds, etc. Infogram also lets you make these designs uniquely yours by allowing you to customize your brand theme with your own logo, colors and fonts.
The designs you have access to are based on the pricing plan you subscribe to.
Publish content online
Infogram can seamlessly integrate with several popular applications. When it comes to media, you can publish your content online through such popular platforms as YouTube, Vimeo and SlideShare. In terms of data, you can share your content through a bevy of websites like Google Drive, Dropbox and Google Analytics. Having multiple channels online lets you reach a wider audience and build more opportunities for engagement and conversions.
Downloadable infographics
Other than publishing content online, you can also download the content you create. This means being able to download infographics, charts, reports, graphs, etc. in different formats. It’s guaranteed that you can export your data visualizations in high-quality PNG, PDF or GIF forms. What this feature does is it makes it easier to share to other people outside of your team or through other channels such as email.
Dashboards
Another feature that is essential in capturing your audience’s attention is interactive dashboards. This gives you the freedom to customize your website or your content to your heart’s content. You can add animations, page links, hover tooltips, interactive charts, tabs, gifs and many more. Not only are you providing valuable information to the reader but you’re also allowing them more opportunities to digest the data quicker and easier.

Infogram Benefits
Users who use Infogram can access more creative tools and business opportunities. This is because infographics allow for optimized interaction and engagement between business and customers. You can push out your messages in easy-to-understand visuals using a cloud-based user-friendly data visualization software solution.
Here are the top four benefits users enjoy from using Infogram:
Powerful features
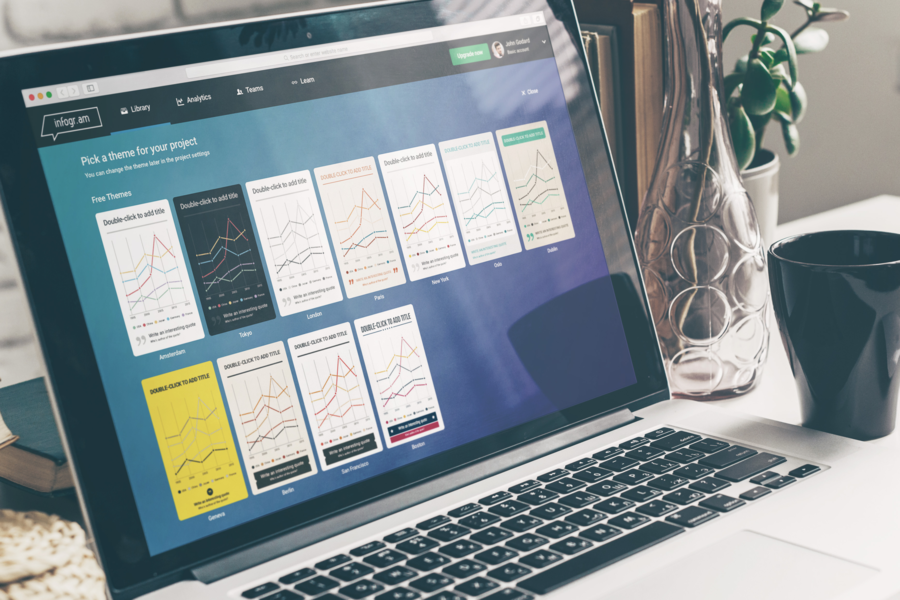
Depending on your pricing plan, Infogram gives users several useful tools and functionalities to create their content. This ranges from interactive charts to map designs. It even has more than 20 ready-made design themes in case you’re not feeling creative on some days.
These powerful features are also simple and straightforward to use. You don’t need to rely on any technical expertise as Infogram boasts of a user-friendly interface. With this solution, users are more than equipped to explore different designs and unique aesthetics.
Drag-and-drop functionality
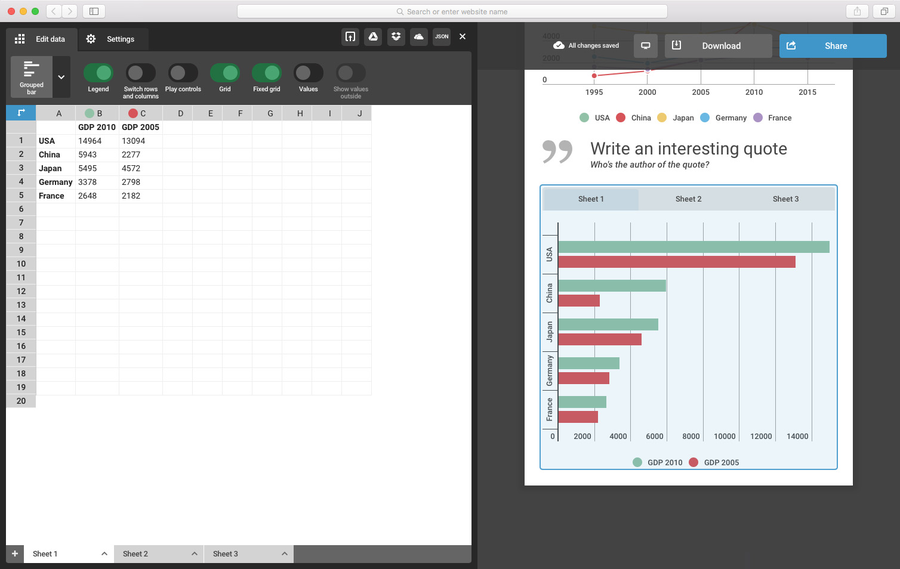
The drag-and-drop functionality is what makes Infogram very easy to use. You can edit infographics by dragging and dropping data into a project. This allows for freedom and creativity in picking out the best display options to go with the necessary information.
Interactivity
Interactivity helps you engage better with your audience. It also helps to keep data fresh and updated. Infogram offers both interactive charts and maps in its solution. What this does is it encourages visitors to explore charts and drive traffic to your site. Additionally, it helps keep them interested in the content you’ve published online.
Analytics
Another benefit you can enjoy is analytics. You can track the performance of your infographics through a series of embedded tools. This includes being able to measure metrics, view detailed demographics and trace the number of people sharing your content.

Infogram Pricing
Infogram’s pricing plans can be separated into monthly and annual billings. When you pay yearly, you can expect to save up to 24%. It offers five pricing plans with varying features and functionalities. The first plan, called Basic, is free. It allows users to have complete control over limited tools and abilities such as 37 plus interactive chart types, up 10 projects, 13 map types and object animations. This plan lets you publish your content online. Even though it is limited, it provides you with the necessary platform to test out Infogram and give you more reason to subscribe to the software solution.
The next plan is Pro, which is suitable for the users who want to download, share privately and access premium templates and images. It’s priced at $25 per month. Its basic features include 100 projects, 100 plus premium templates, 550 plus map types, HD images, privacy control and live data.
After Pro is Business, whose prices start at $79 per month. It provides users with a larger library, unlimited pages per project and logo upload. Some of its additional features include basic analytics, SQL connectors, version history and interactive charts and page linking. This is the best-valued plan, according to Infogram.
After Business is Team, which is priced at $179 per month. It has everything that Business offers but with real-time team collaboration and engagement analytics. It allows for commenting, tracking links and training functionalities.
Lastly, Infogram offers Enterprise which is tailored specifically for your standards and requirements. You can contact them for a quotation. Its core functionalities include up to 10,000 plus projects, multiple teams with 10 users, advanced training and dedicated account manager, SSO, custom development, web tracking opt-out and more. It’s best suited for big enterprises with a large workforce.
If you’re interested in trying out Infogram, payment options range from Visa and Mastercard to American Express and Paypal. If you want to modify your subscription, you should do so a few days before the next scheduled payment. Additionally, you can cancel your subscription at any time, but refunds will not be available.
Conclusion
When it comes to creating engaging infographics and interactive reports, one of the best tools to use in the current market is Infogram. It caters to users with its easy-to-navigate interface and user-friendly services. Its core features help create fully responsive infographics and offer highly effective visuals. If you need assistance in making data and information fun and visually appealing too look at, then you can certainly consider Infogram.
Not only are you equipped to make creative logos or graphs and charts, but you can also collaborate with team members in real-time. You can download, share and publish online as well. This gives you more opportunities and possibilities to optimize collaboration and teamwork. At the end of the day, Infogram provides users with the necessary tools and features needed to captivate your audience with stunning visuals.


