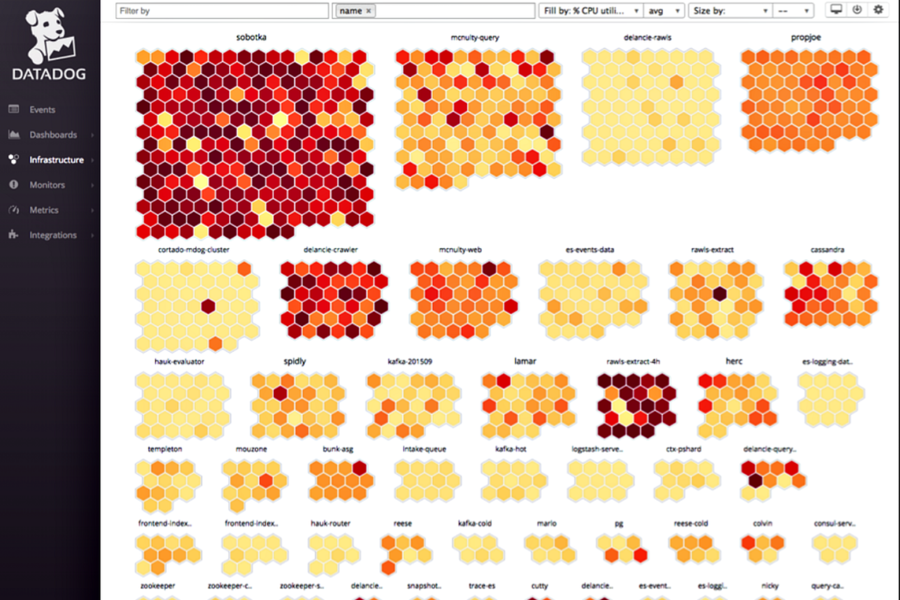
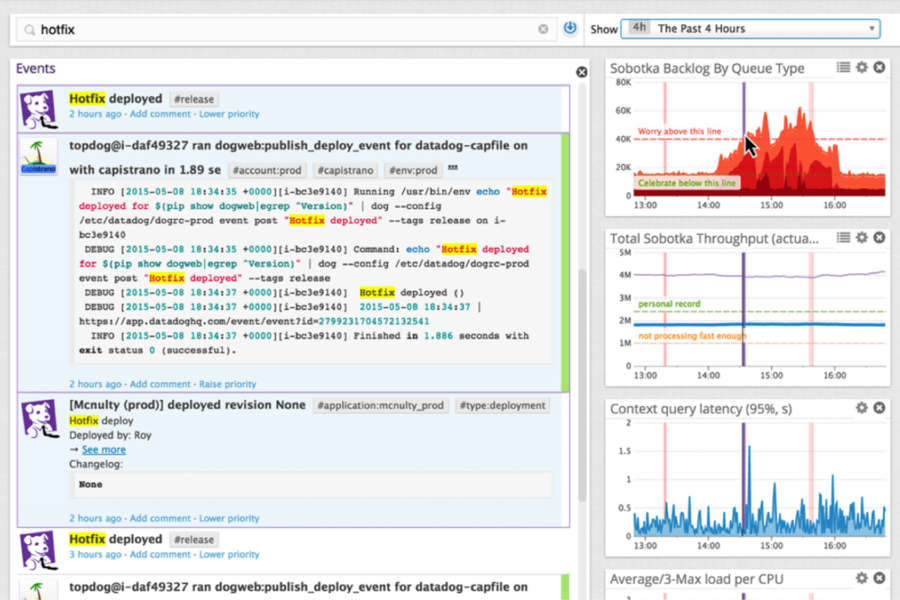
Datadog is a network monitoring, infrastructure management and application monitoring solution served in a software-as-a-service (SaaS) package. It comes with high-end analysis capabilities, agents that you can easily install on a number of platforms and customization options available through various application programming interfaces (APIs).
The cloud-based network monitoring platform is designed to help businesses and organizations gain much-needed visibility into their application performance. Datadog gives users an overview of a particular product through a single structured query language (SQL) and then correlates application performance, including identified errors, with infrastructure events and key metrics.
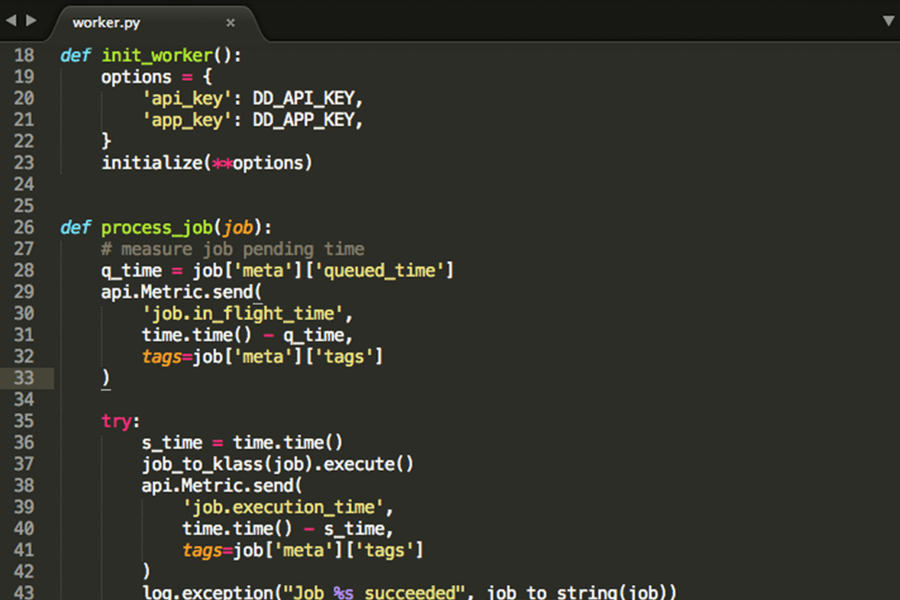
Datadog is very useful in identifying potential performance bottlenecks in your infrastructure or code, and it is fully capable of monitoring containers and hosts. The SaaS solution can also automatically track requests across multiple frameworks and libraries. It allows for automatic instrumentation to gather spans from frontend to backend.
The infrastructure management solution also collects valuable performance data from key infrastructure components such as Elasticsearch and Redis, and provides third-party integrations with web-based frameworks like Ruby on Rails, Gin and Django. Real-time dashboards are available, with mix-and-match metrics and events from various integrated applications, containers, services and hosts.
Datadog is designed to help companies identify and resolve potential issues as quickly as possible, before it reaches the end-user and causes all kinds of problems. The SaaS solution integrates seamlessly with more than 200 widely used services and tools in different industries. This makes the monitoring process of all components within a company’s tech stack that much easier and more efficient.
Datadog Features
Datadog is specifically designed to serve the needs of IT professionals, software developers and app operations teams, giving them the services and capabilities they require to effectively monitor the overall performance of their applications, services and offered tools. The cloud-based solution is capable of gathering incoherent or disorganized data from different sources and turning them into retailed yet easily digestible insights. The following are some of the key features that make this possible:
Network monitoring
Datadog’s network monitoring feature gives you the ability to visualize the flow of traffic within your cloud-native environments. It gives you a better understanding of performance by utilizing meaningful human-readable tags. The tool allows you to leverage tags to effectively filter traffic both by source and by destination.
You may also use grouping to better visualize performance, from datacenters to teams and individual containers. Reporting is also available, of key metrics like transmission control protocol (TCP) retransmits and traffic load or volume.
Log management
You can use log management tools to efficiently analyze, explore and contextualize your log data. Run quick searches, proper filtration and in-depth analytics on your logs for comprehensive troubleshooting and open-ended exploration of all relevant data. Save a considerable amount of time by automatically gathering crucial data logs from all your applications, platforms and services.
Datadog’s log management feature allows you to easily navigate between key metrics, request traces and data logs. You will be able to view log data within their context through automated tagging and correlation. You may also utilize alerts and visualization on all your log data.
Real user monitoring (RUM)
Gain useful insights into the correlation between frontend performance and business impact concerning your applications, services and offered tools. The tool provides you with relevant user experience metrics, which you can use to prioritize business and engineering decisions. With RUM, you also have the ability to visualize key resources, frontend errors and load times for every user session to make sure your applications and services are performing well.
You can filter your data, reorganize and prioritize them using custom attributes offered by the system. It also allows you to perform efficient troubleshooting with frontend and backend data, as well as key business metrics all in a single dashboard.
Real-time interactive dashboards
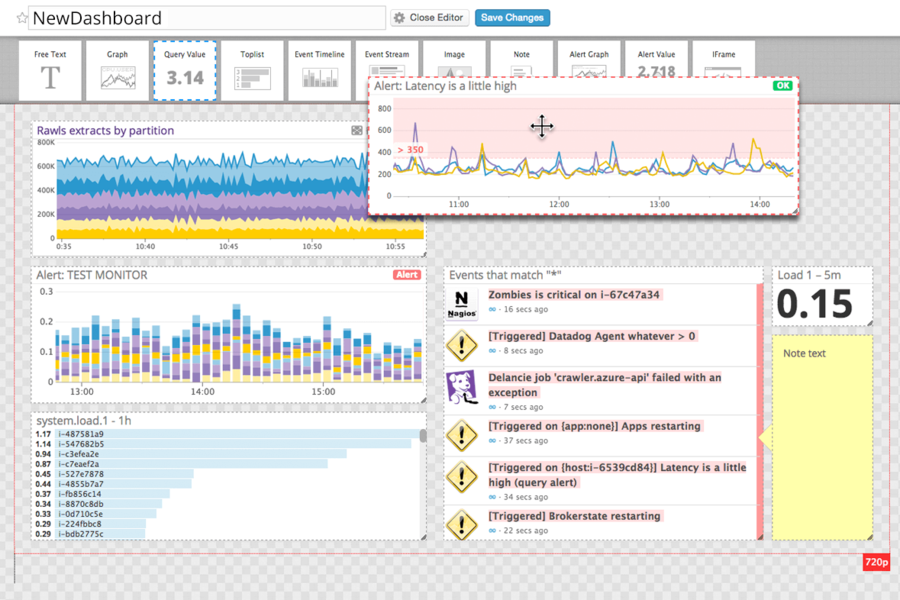
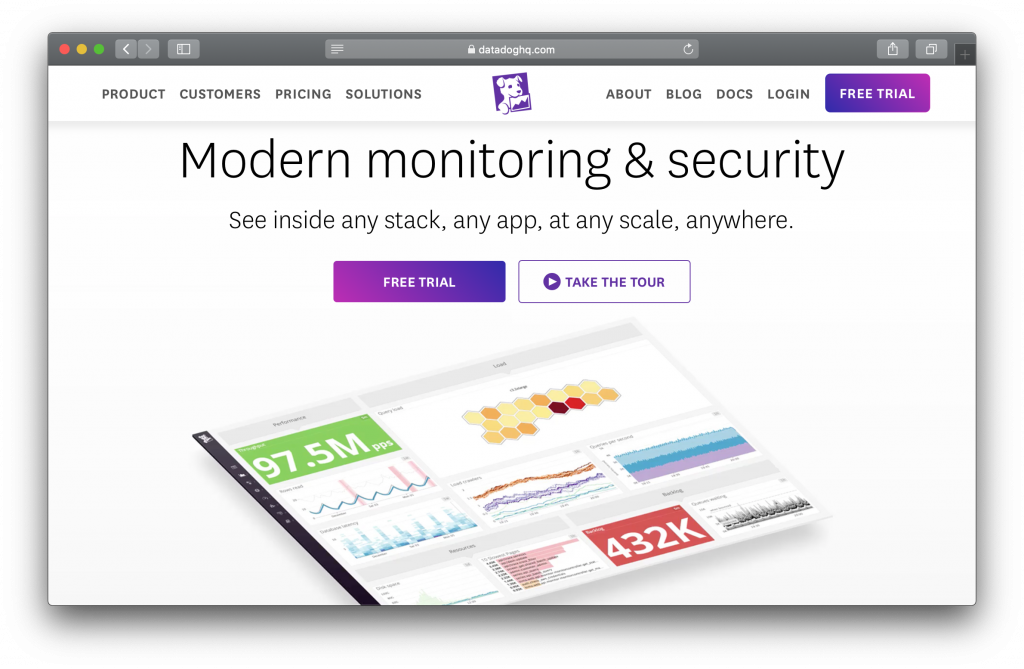
Datadog gives users the ability to create real-time interactive dashboards, which is way more advanced than your standard summary dashboard. The cloud-based platform offers all high-resolution metrics as well as events to be used for detailed graphing and manipulation. You will be able to view high-res graphs in real-time across different sources. You can create graphs with data divided by device, host or any other tag you find more suitable to your specific situation.
With Datadog’s real-time interactive dashboards, you may also perform quick calculations regarding, averages, ratios, integrals and rates. You may then customize your views with relative ease, either interactively or in code.
Cloud-native security monitoring
This particular feature allows for real-time threat detection across all services, applications, network and the entire infrastructure. Datadog is equipped with robust security designed specifically for dynamic environments. It can detect potential threats to your dynamic cloud environments in real-time and helps breakdown silos across multiple teams, including operations, security and development teams.
Gain total security visibility across all your applications, infrastructure, network and other offered services with more than 400 vendor-supported integrations. You and your team can start consuming relevant security data within mere minutes with various built-in integrations such as Okta, G-Suite and Amazon Web Services (AWS) CloudTrail. With in-depth data logs, traces, metrics and more, you can efficiently detect and investigate security threats with just a single centralized dashboard.
Synthetic monitoring
This feature allows you to proactively monitor and keep a close eye on your end-to-end user experience with just a single platform. Using a simple to use web recorder, you can effectively monitor crucial user journeys and experiences. With AI-driven, self-sustaining tests, you can limit or at least reduce your reliance on IT and engineering resources.
Synthetic monitoring empowers your team with the ability to detect and provide alerts on performance issues and concerns for all users, regardless of their location. It also lets you manage your service-level objectives (SLOs) and service-level agreements (SLAs) more efficiently.
Application performance management (APM)
Get more in-depth visibility for all your modern applications with Datadog’s APM solution. This feature lets you search, gather and analyze traces throughout various fully distributed architectures. Easily find traces matching a particular customer, user, service, endpoint, error code or custom tag without wasting time or resources.
You can navigate through applications quickly and seamlessly with the Datadog’s Service Map. The SaaS solution is designed to facilitate live root-cause analyses in an effort to minimize the time spent on troubleshooting and finding solutions to specific issues. It helps IT and development teams release features more quickly without worrying about potential bugs and code errors that may impact the end-user experience.
Datadog Benefits
Datadog is the premier monitoring, analytics and security solution designed to serve IT operations teams, security engineers, developers and businesses with hybrid cloud environments. Delivered via SaaS, the platform is fully capable of integrating and automating key processes such as application performance monitoring, infrastructure monitoring, log management, security monitoring, real user monitoring (RUM) and so much more, all this in an effort to provide centralized and real-time visibility for the user’s entire technology stack.
With Datadog, you can easily connect and directly compare key metrics and other relevant data across all applications and services, including those coming from other databases such as Amazon EC2, StatsD, SQL and NoSQL, as well as web servers.
The platform enables users to streamline key tasks such as information analysis and other similar processes like measuring and graphing incoming data. Such processes can be accomplished within a matter of seconds, instead of minutes or even hours with conventional means. Users are also afforded the tools and capabilities to effectively configure data filtration options so it is set up to collect only the metrics they can actually use.
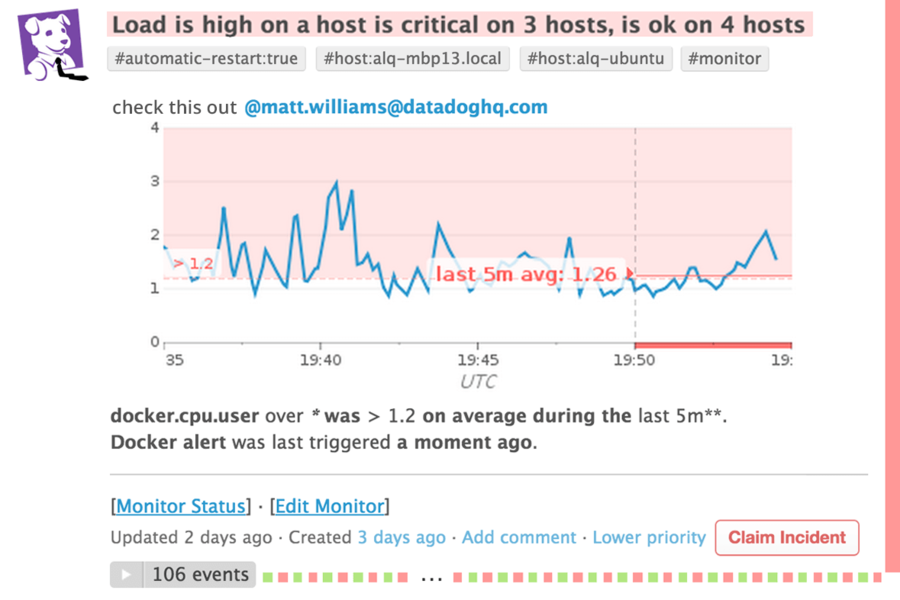
The system can easily be tweaked to send notifications and alerts pertaining to issues that require the immediate attention of a specialist or the appropriate team member. It also enables teams and individual users to pay close attention to scheduled operations, assigned tasks, significant updates and the right code configurations.
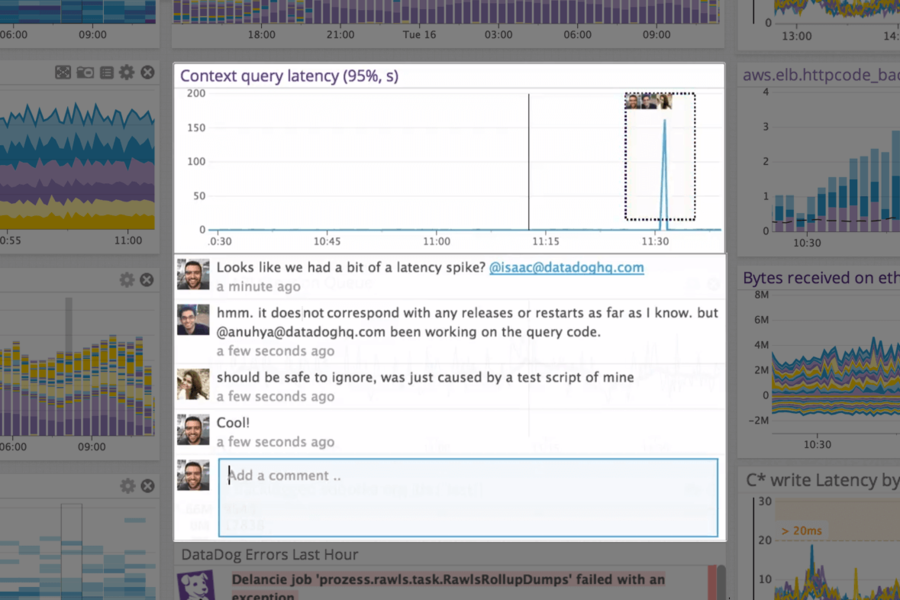
Finally, Datadog is packed with robust and extensive collaborative tools, which allow you and your team to work together seamlessly as a single unit to accomplish tasks, meet deadlines, resolve issues and streamline workflows as well as optimize the use of available resources.
Datadog Pricing
Datadog charges different pricing for each product it offers. This is meant to ensure maximum value for the customer. You only pay for the service or the product that you actually use. The following is a summary of the vendor’s pricing and product options:
Infrastructure package is available in three versions: for free, as a Pro plan and for Enterprise users. Pricing starts at $15 per host per month for the Pro plan and $23 per host per month for the Enterprise plan.
Serverless package starts at $5 per function per month. It gives you the ability to monitor, detect and resolve errors and potential bottlenecks. Key features include real-time serverless metrics, trace function invocations, out-of-the-box service map and more.
Log management comes with two options: Ingest and Retain. Ingest starts at $0.10 per ingested/scanned gigabyte per month, while Retain starts at $1.27 per million log events per month. Log management features include unlimited sources, log analytics and dashboards, unlimited user accounts, enterprise-grade security and more.
APM or application performance management starts at $31 per host per month. It comes with distributed tracing across hosts, containers and microservices. It also features out-of-the-box dashboards capable of displaying latency, throughput, errors and Apdex for individual endpoints, database queries and services.
You may visit the vendor’s official website for more information on other available products, the starting price and the features and tools that come with them.
Conclusion
If you want robust and highly customizable dashboards in a cloud-based infrastructure management solution that is feature-rich and reliable, Datadog is a good option. The SaaS platform is designed so that it’s easy to set up and efficient to operate. Its more than 400 integrations make it the ideal choice for your application and network monitoring needs. The vendor is offering a free trial, so testing out the service shouldn’t be a costly decision for you.
