
Online Chart Tool is a completely free online charting and infographics software solution developed by Zygomatic, an online gaming network ad game publishing company. Although the company is well known for publishing mostly web-based games like Mahjong and Solitaire games, they do develop and publish several productivity tools such as Word Clouds, Free Online Photo Editor, and the software product this review covers.
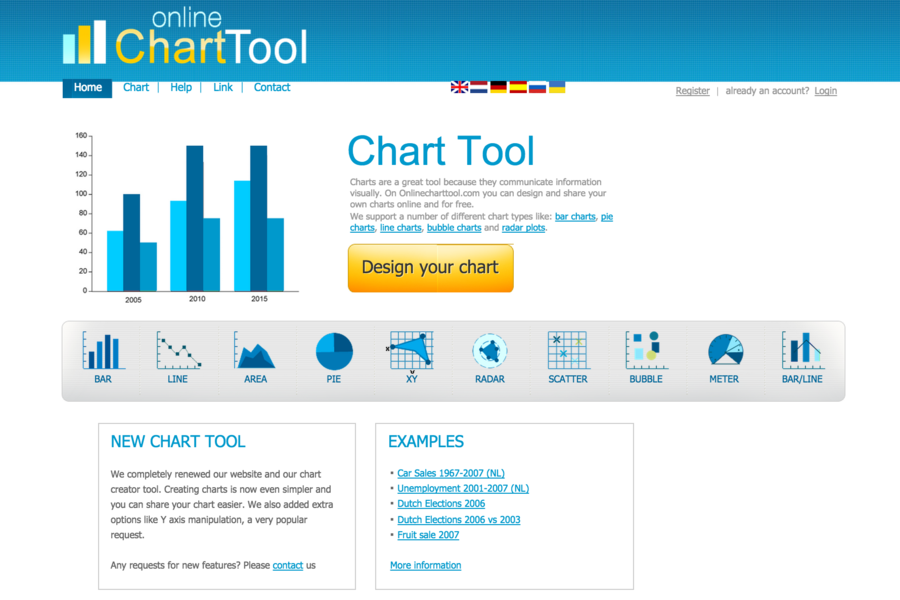
Online Chart Tool, or more accurately—OnlineChartTool.com—is a web-base designed for individuals, businesses, and virtually anyone who needs a product that allows them to create, edit, and share different types of charts and graphs online.
The website receives more than a hundred thousand unique visitors a month, which speaks volumes about its usefulness among various individuals across multiple industries. The web-based charting platform is available in multiple languages, including English, German, and Spanish to name a few.
Online Chart Tool Features
Online Chart Tool works in the simplest way possible. It is web-based, which means there is no software installation and configuration necessary. Simply open a web browser on your computer or mobile device, go on to onlinecharttool.com and sign up or log in, and you can start creating, editing, and sharing your charts and graphs.
In almost every industry, managerial and administrative tasks almost always include charts and graphs—whether it’s to illustrate quarterly sales, projected profits, some sort of statistical analysis, or just a basic maintenance chart on company equipment. Whatever the purpose, charts and graphs are effective forms of visual communication that allow users to efficiently show or share comprehensive, easily digestible data to their audience.
Online Chart Tool allows you to create, edit, and share different types of graphs and charts completely free. While there may be many off-the-shelf charting software solutions out there, if you’re looking for a charts and graphs tool that is readily available and easy to use, this is one product you should consider.
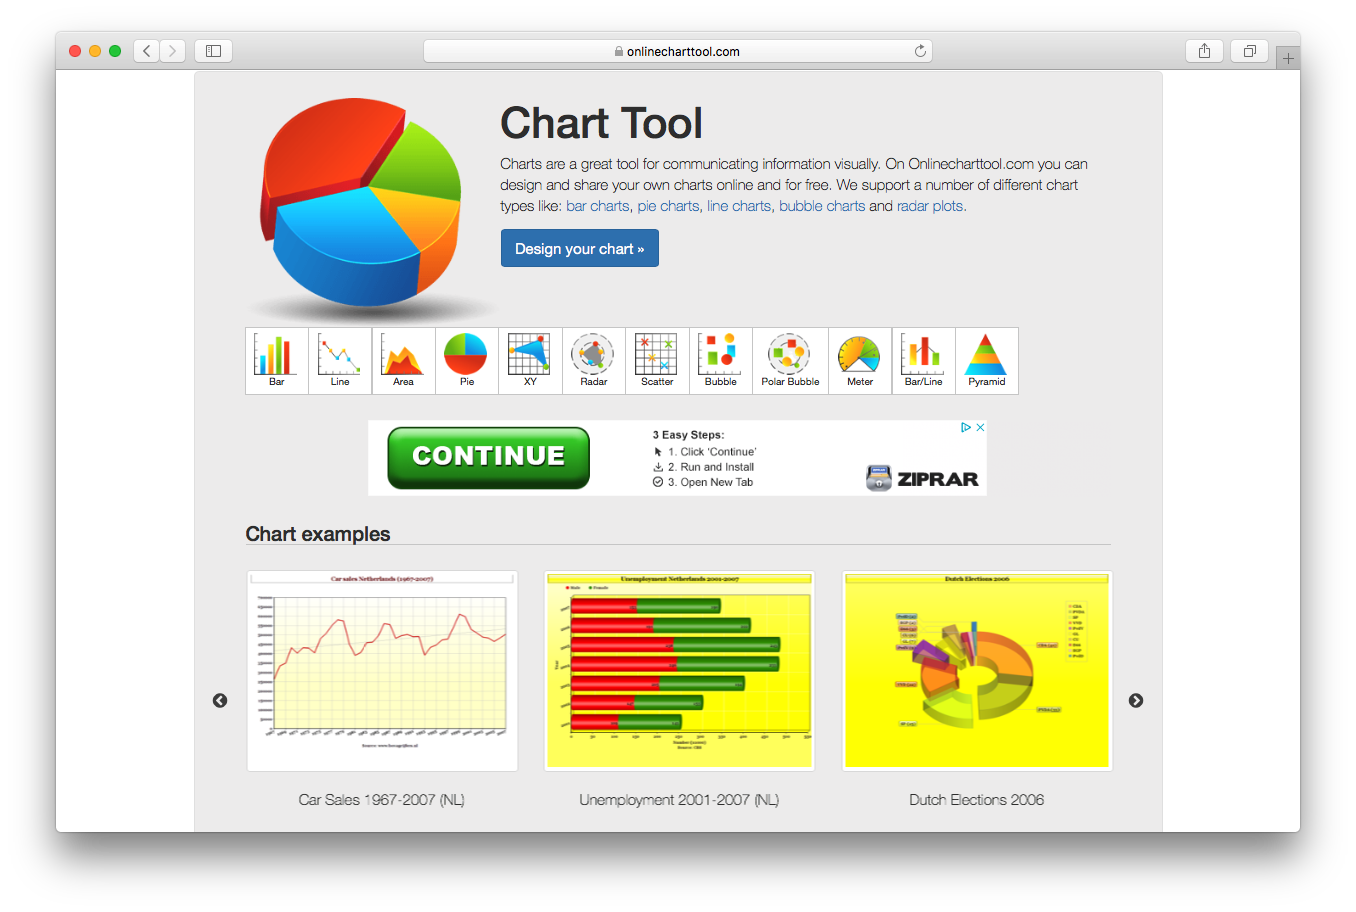
The platform supports a variety of chart types—12 to be exact. There’s the area chart, bar, bar/line, bubble chart, line chart, meter, pie chart, polar bubble, pyramid, radar, scatter, and XY chart. You have a feature-rich charting toolkit with this web-based solution. But how does it work?
With Online Chart Tool, users can build or design their charts in five simple steps. These are:
Design Chart
This is the first step of creating a chart or graph. In this step, you choose the type of chart you want to create. Any of the 12 chart types mentioned can be chosen. After choosing the type of chart you wish to go with, you can personalize your chart further by tweaking the different parameters available (color, grid line color, legend position, and more).
Add Data
The next step is to add the data to a chart. In this step, you can enter your graph title, configure your data set, choose font colors for your title and background, and enter specific values to individual fields or item number. There is also an option to import a CSV file for quicker and more efficient data entry.
Labels and Fonts
In this step of the chart/graph design process, you get to choose your data labels and fonts. You have the option to show labels or not. There is also a prefix and suffix field that you can fill in, an X-axis label step and X-axis label direction, as well as the Y-axis position and style. The font size and label color may also be chosen.
Preview Chart
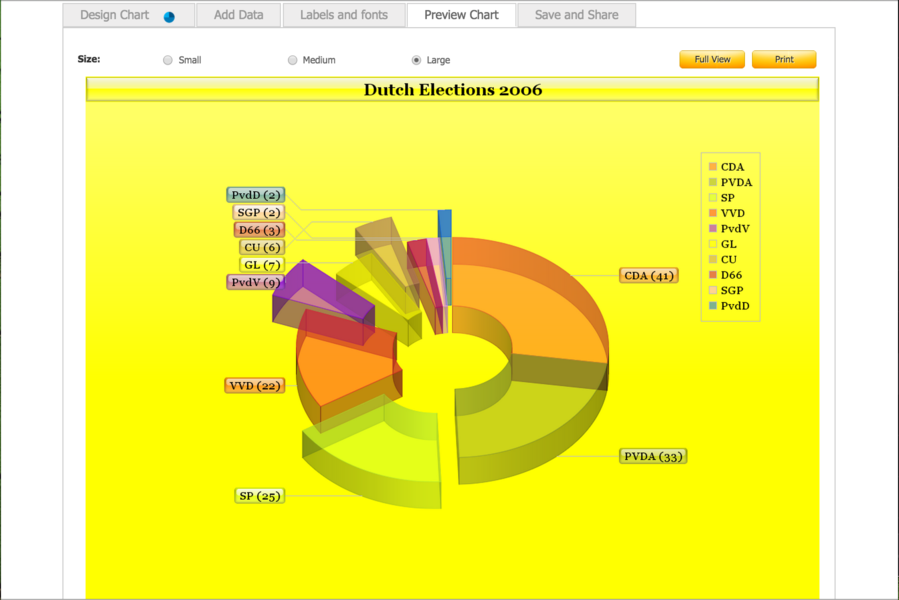
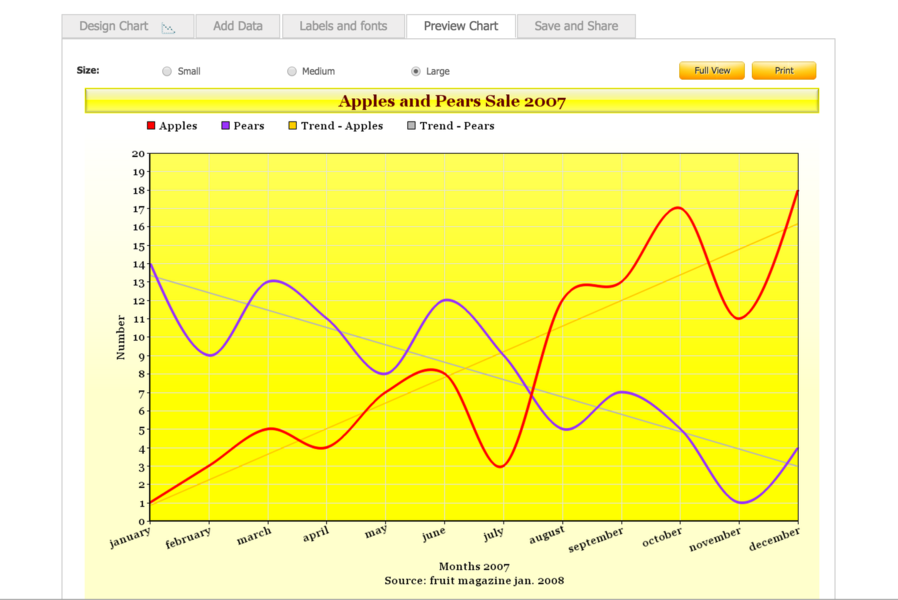
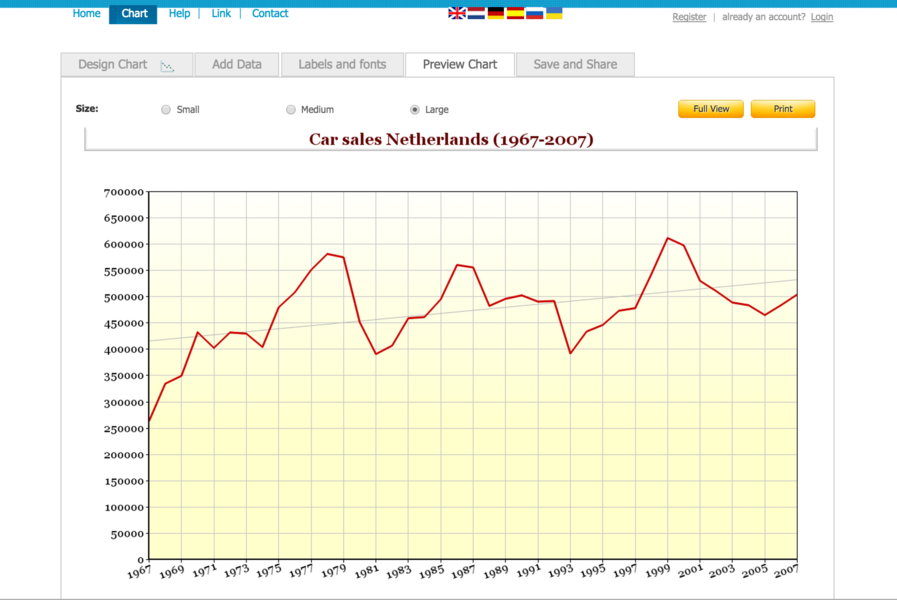
This is the step where you get to review a chart or graph. You can double- or triple-check your data to make sure they are accurate, check all your settings—i.e. font size, background colors, labels, and so on—, and see the overall look of your chart. If you do find errors in your data or your settings, you can always go back a few steps to correct those errors. In this window, you can also choose to view the chart you’ve created in full screen, choose a size—small, medium, or large—, and print a copy of the document.
Save and Share
Finally, in this step, you can choose to save the graph in various file formats (SVG, PNG, JPG, PDF, or CSV) and download it to your computer or send it via email. If you are registered and logged in, you may also choose to save the file via the website for future editing or save it online as a chart image.
In addition to the chart tool, the platform also offers several applications that complement the base Online Chart Tool. These apps include Photo Resizer, Photo Editor, Word Clouds, Photo Collage, GlitterPhoto, Toony Tool, and Print Screenshot.
Online Chart Tool Benefits
Many benefits can be had from a web-based software solution such as Online Chart Tool. For one, it’s web-based, which means you don’t have to install it. As it is web-based, you will be able to access saved graphs and charts virtually anywhere and anytime, using any device. All that is needed is a stable internet connection and your account name and password.
Another obvious benefit to using Online Chart Tool is its user-friendly design. When you visit the website, everything you need to know about the online software solution is right there, plain and simple. There is no need to dig up instructions or browse through a how-to page just to be able to use the platform. This online solution is certainly designed for accessibility and ease-of-use. It’s a reliable solution for when you need to generate a few charts and graphs in a short amount of time.
The ability to import a CSV file to enter existing data and incorporate it into your graphs and/or charts is also a good addition. Simply import your data, make a few adjustments, and you’re ready to save and share.
Finally, perhaps the most obvious benefit to this web-based product is it’s 100% free. You can just use it immediately and start creating your graphs. If you register an account though, there are a few more options to take advantage of, especially when it comes to saving your work. Regardless, registering an account is still completely free.
Online Chart Tool Pricing
Online Chart Tool is 100% free. There is, however, an option for you to donate to the developer via PayPal.
Conclusion
For the price of $0, this one is a no-brainer. Online Chart Tool is a 100% free, user-friendly web-based solution that is readily accessible and quite useful. Using it won’t cost you anything. Hence, if you’re someone who often deals with graphs and charts, such as if your job requires you to create and present data in graphical form, you might want to check out this product.