

Create easy, powerful Asana reports and dashboards to understand where your team spends time, make estimates, and improve velocity.
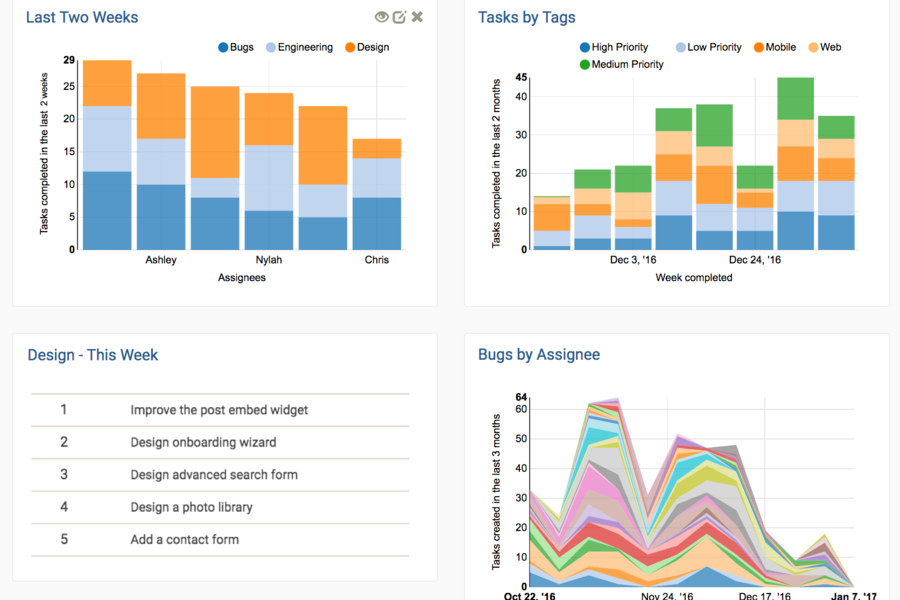
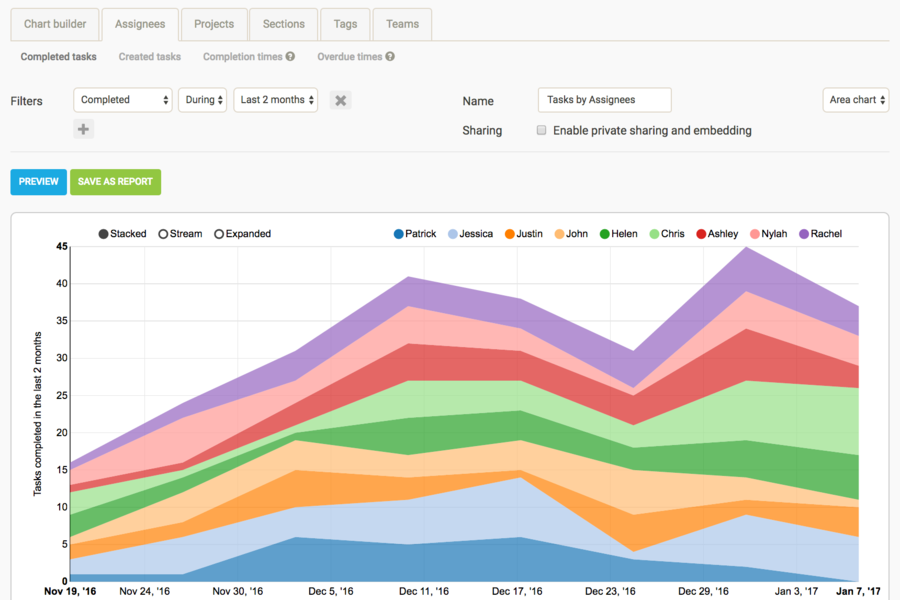
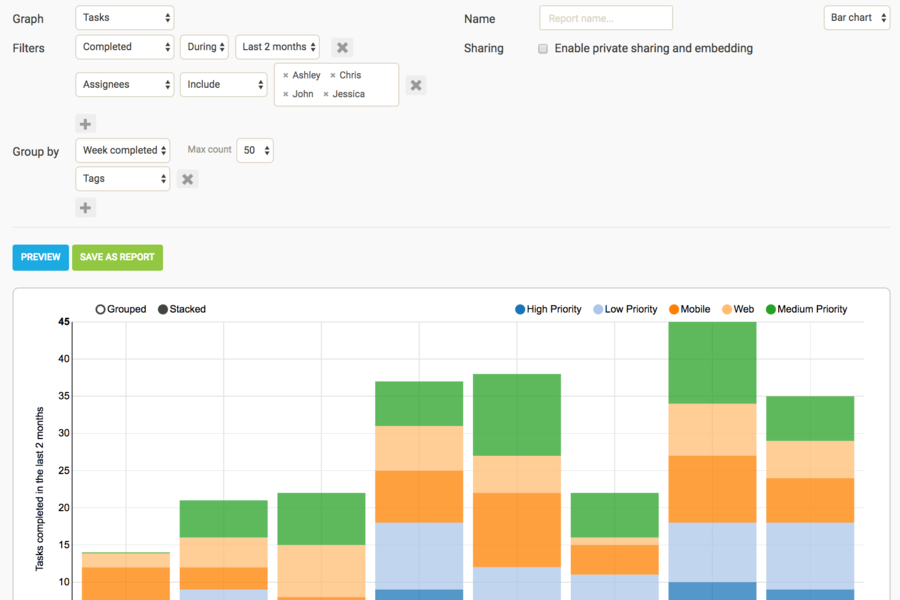
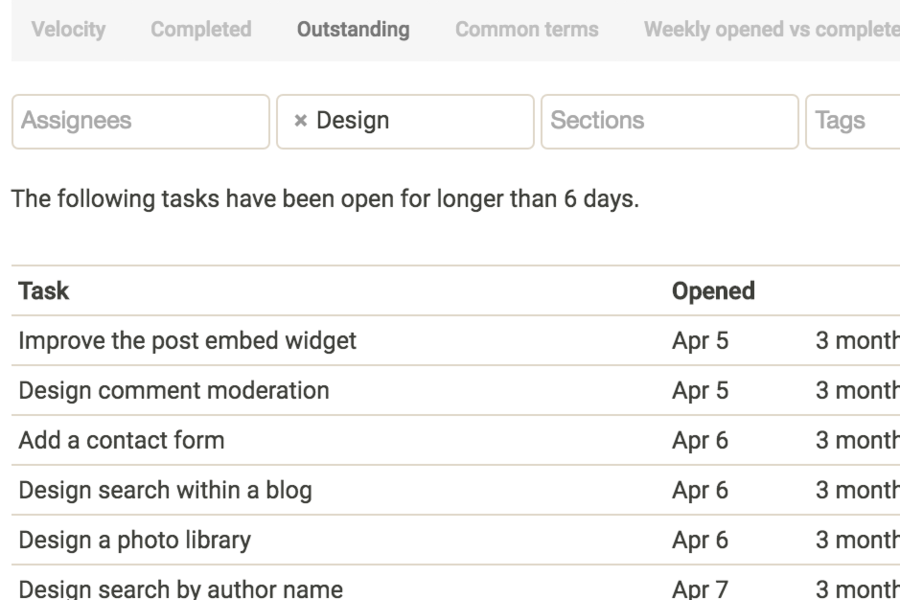
With Velocity, you can create dashboards with customizable charts and pre-made reports to get insights about your team's work in Asana. You can understand where your team spends time and make better time estimates, improve velocity, and find opportunities for growth. You can also securely share this data with anyone, export to CSV, and more.
Velocity currently scores 86/100 in the Reporting Dashboard category. This is based on user satisfaction (92/100), press buzz (27/100), recent user trends (falling), and other relevant information on Velocity gathered from around the web.
| The score for this software has improved over the past month. What is this? |
Easy, powerful Asana reports, dashboards, and analytics!

Product recommendations, vendor rankings, market overview and tips on how to select Reporting Dashboard software for business. Published in May 2024.
Reporting dashboards consolidate and organize data generated from different analytics solutions in one centralized system. You can view key information about your business performance on a clutter-free and customizable dashboard, allowing you to keep the mo...
FREE DOWNLOAD Reporting-Dashboard-Software-Buyer-Guide-2018.pdf