
Use Gist to turn data into beautiful, interactive microsites that enable teams, organizations and audiences to explore data and share insights.
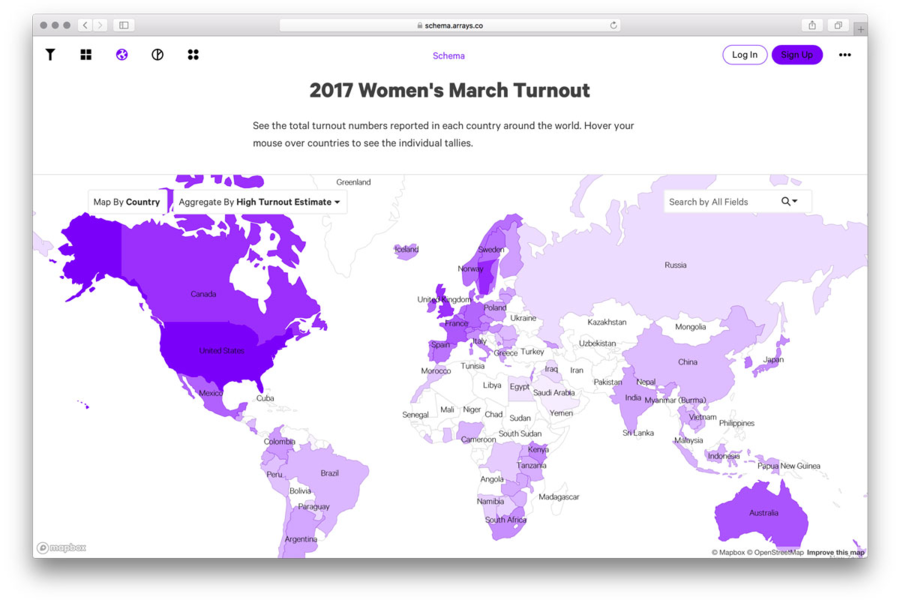
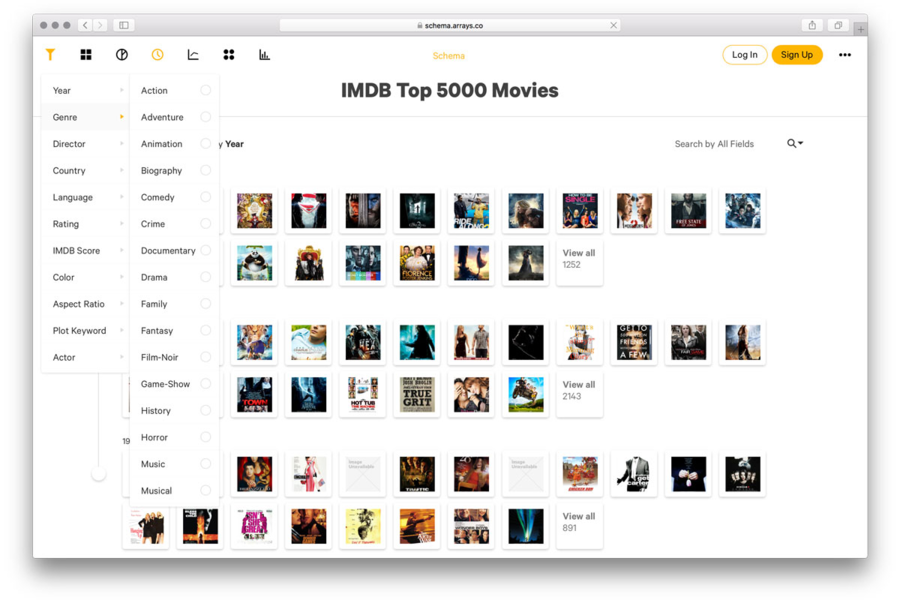
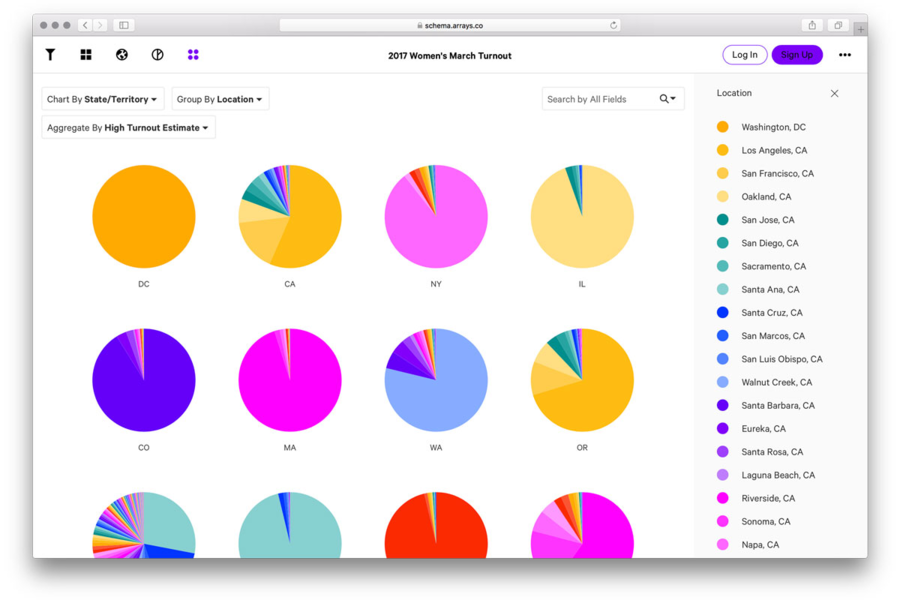
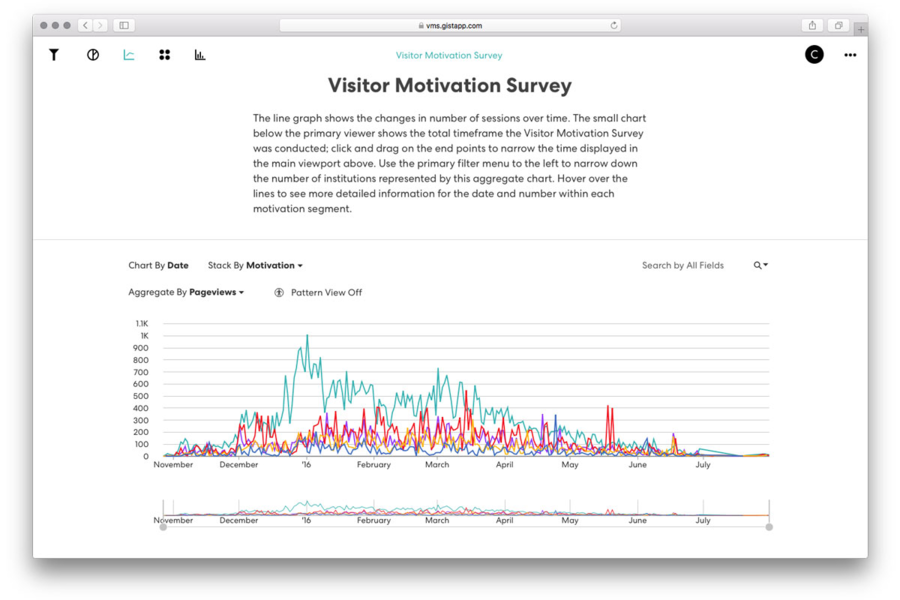
Visualize data using galleries, maps, and interactive charts and graphs. Use Gist to explore data visually, for knowledge management, data publishing, and for adding context to digital collections.
Find information using simple, intuitive interfaces for browsing structured data. Share analysis via articles with embedded visualizations.
Publish beautiful visualizations online and drive engagement with your audience. Embed visualizations on your website, and create dialog via user annotations.
Understand the breadth and depth of a collection via browsable galleries and data visualization interfaces. Bring data to life via fluid, interactive data visualizations.
Gist currently scores 88/100 in the Data Visualization category. This is based on user satisfaction (92/100), press buzz (24/100), and other relevant information on Gist gathered from around the web.
| The score for this software has improved over the past month. What is this? |

Product recommendations, vendor rankings, market overview and tips on how to select Data Visualization software for business. Published in May 2024.
Data visualization software can be used to generate easily understandable visual representations of data based on key business metrics. These solutions enable users to create dashboards from their data in a simple manner by providing features such as drag-a...
FREE DOWNLOAD Data-Visualization-Software-Buyer-Guide-2018.pdfMuseums, libraries, archives, research organizations, think tanks, and corporations
All web browsers
Yes
Yes
Yes
Integrates with Salesforce, data.world, and various other 3rd party apps
Data exploration, data publishing and visualizing digital collections