
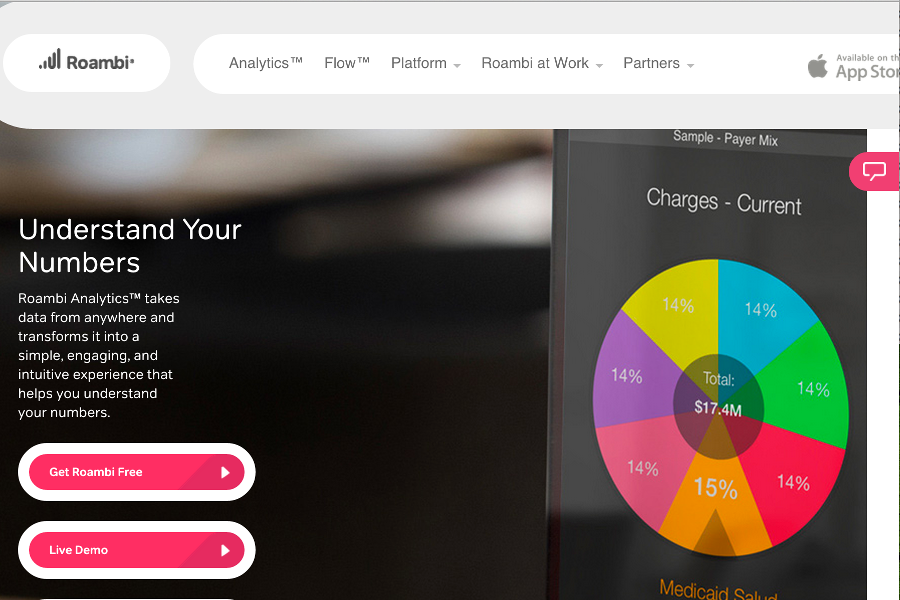
Roambi re-designs the way you interact with, share, and present data from a completely mobile perspective.
Roambi re-designs the way you interact with, share, and present data from a completely mobile perspective. Easily transform data from any source into stunning, interactive, mobile-first visualizations that provide information to everyone in the moments they need it, on the devices they use the most.
Unlike traditional BI systems that deliver dead, static reports - or complex analytics engines designed for power users, Roambi focuses on delivering rich, engaging experiences to data on the devices that everyone has with them all the time. The result is increased adoption and usage of data by everyone from the corner office to the corner store.
Roambi Analytics currently scores 76/100 in the Data Visualization category. This is based on user satisfaction (80/100), press buzz (43/100), and other relevant information on Roambi Analytics gathered from around the web.
| The score for this software has improved over the past month. What is this? |
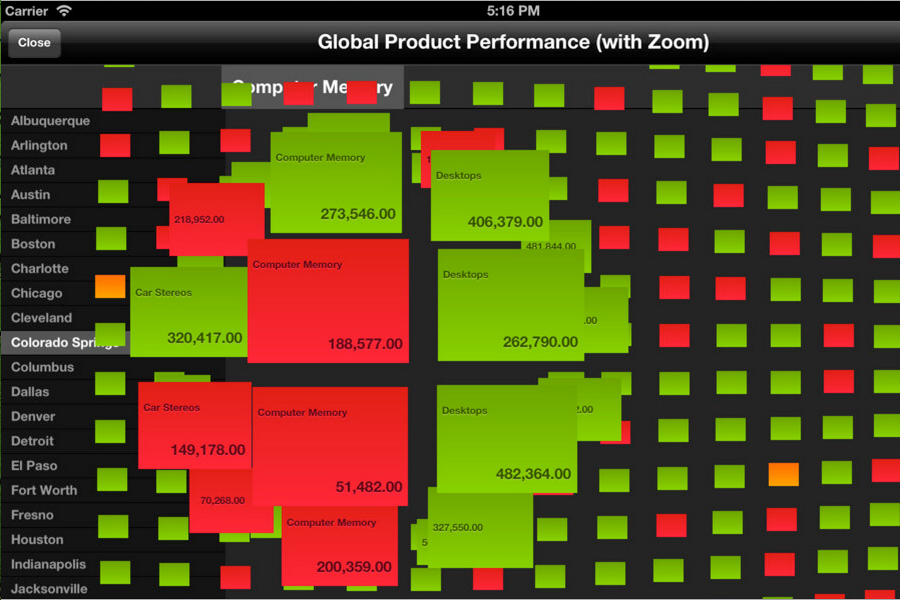
Designed and built for mobile
Optimized for tablets and phone experiences
Brings all your data into one app
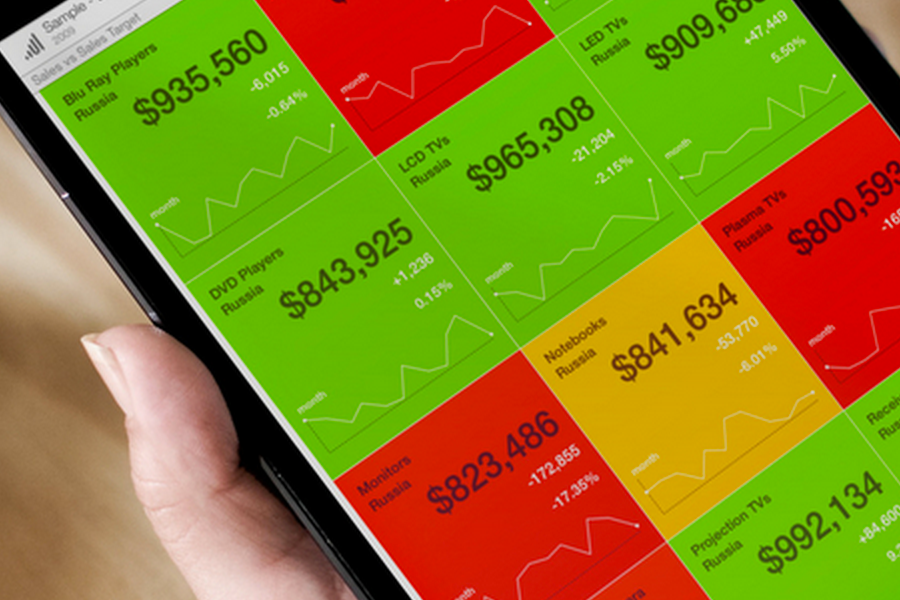
Native Apps with lightning fast performance and offline access
Cloud backend for data connectivity and admin

Product recommendations, vendor rankings, market overview and tips on how to select Data Visualization software for business. Published in May 2024.
Data visualization software can be used to generate easily understandable visual representations of data based on key business metrics. These solutions enable users to create dashboards from their data in a simple manner by providing features such as drag-a...
FREE DOWNLOAD Data-Visualization-Software-Buyer-Guide-2018.pdf