Written by Philip Howard (Bloor Software Analyst)
Philip’s a Bloor Software Analyst who started in the computer industry way back in 1973. He worked as a systems analyst, programmer and salesperson, as well as in marketing and product management roles, for a variety of companies including GEC Marconi, GPT, Philips Data Systems, Raytheon and NCR. More about Bloor...
In this paper we explain what graph processing is, why it is important, what the different approaches are, and which approaches are most appropriate for which types of use case.
Graph processing is becoming increasingly popular. However, as is commonplace within the IT industry different vendors use different approaches, use different terminology or use the same terminology to mean different things. In this paper we explain what graph processing is, why it is important, what the different approaches are, and which approaches are most appropriate for which types of use case. We also need to consider where specialist graph capability is required and why comparable capabilities cannot be provided – or cannot be provided with adequate performance – by traditional technology.
To begin with, we are not talking about charts with an x axis and a y axis. A graph in the current context is a mathematical construct that depicts links between things. In its very first form it was used to depict bridges between the different parts of Königsberg, which was based on two islands in the middle of the river Pregel and settlements on both banks of the river.
In IT terms, graphs are represented in one of two ways: either as relationships between entities or, in semantic terms, as a “subject-predicate-object” triple.
In IT terms, graphs are represented in one of two ways: either as relationships between entities or, in semantic terms, as a “subject-predicate-object” triple. From a logical perspective these are clearly variants on the same thing. However, there are implementation issues with respect to these different perspectives, and we will consider these in due course. For convenience we will use the terms “entity” and “relationship” in the following discussions, until we have had a chance to discuss the difference between these approaches.
In practice, the idea of relationships between entities is hardly new: being able to capture relationships is at the heart of relational databases (that’s why they are called relational) and is a fundamental concept within data modelling (entity-relationship [E-R] diagrams and the like). However, relational databases and E-R modelling are typically about one-to-one and one-to-many relationships while graphs encompass many-to-many relationships. Graphs also tend to be more granular, in that you are relating individual data elements rather than higher-level relationships in a relational database. When there are many to many relationships one side of this equation tends to get bundled together in a one size fits all fashion that may not actually fit the real world.
When it comes to many-to-many relationships these are expressly forbidden within relational algebra. The classical issue is a bill-of-materials where the same parts, components and sub-assemblies may be used within multiple products. These are notoriously difficult to implement in relational databases, which is one of the reasons why ERP applications from vendors such as SAP and Oracle are so complex: because they have to build in workarounds to the constraints imposed by the underlying database. The same applies in many other common business scenarios: consider, for example, management structures with “dotted line” responsibilities.
The ability to support many-to-many relationships is not the only reason why graphs are different. In a graph you can have one way relationships. For example, the last time we looked, Katy Perry was following 140 people on Twitter but had 53 million followers! Now, there are relationships both ways: “follows” and “is followed by” but you may be only interested in the former if, for example, you want to know who influences whom. Or you may want to treat them as distinct relationships. So graphs, at least in some instantiations of graph technology, allow for the possibility of associating a direction (or arrow) with a relationship. These are known as directed graphs. In addition, again depending on the technology, it may be possible to assign attributes to entities and weightings (or probabilities) to relationships. We will discuss this further in due course but the latter, in particular, means that you can assign a value to a relationship: for example, how likely is one person to influence another.
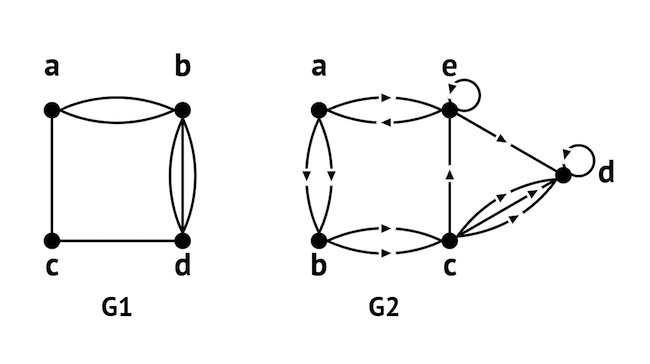
Figure 1 shows examples of a non-directed and a directed graph. Note that there can be multiple relationships between any two entities and that entities may have relationships with themselves.
With respect to terminology, it is typical to refer to the diagram as showing vertices and edges (sometimes nodes and lines or nodes and relationships), which represent the entities and relationships respectively. You may also hear people talking about “traversing the edges of a graph”: what they really mean is that they are following relationships between a starting entity and a remote entity, often to discover previously unknown relationships.
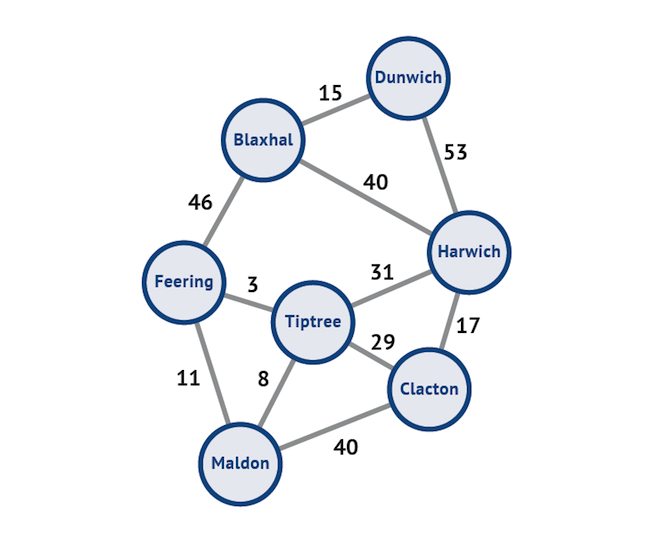
Figure 2 is another instance of a graph, this time distinct values have been associated with each edge (which, in this case, represent distance in miles).
As a very simple example of attributes you might associate with each of these vertices, you might assign the attribute “seaside” to the towns Dunwich, Harwich and Clacton and the attribute “inland” to the other four towns. You could, of course, have separate entities for “seaside” and “inland” and then link these to each of the relevant towns but this would make the graph more complex and would result in a proliferation of entities and relationships. Note that there are multiple attributes that you might like to handle in this way: which county the towns are in, their respective populations, and so on. Alternatively, you can have graphs that relate towns to counties to countries and to continents and this can be quite useful for some sorts of complex location-based analytics.
Graphs with attributes associated with their vertices and edges are referred to as “property graphs”. This concept can be extended further by allowing properties to have properties and by providing what are known as “labelled property graphs”. An example of a label in this context would be to distinguish between multiple personas, for instance Clint Eastwood the person, Clint Eastwood the actor, Clint Eastwood the director and so on. Note that the first of these is a unique identifier to which appropriate constraints can be applied, while the other two examples are informational rather than definitive, which can be used to group nodes together (with other film directors, for example). In any case, this is a method of reducing node and edge proliferation. Note that “seaside” and “inland” could also be implemented as labels.
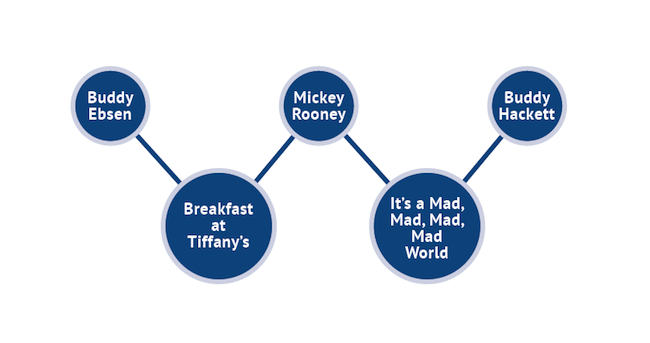
You can also have bipartite graphs, an example of which is illustrated in Figure 3 where we are mapping actors to movies but it could be, for example, customers and products. As with other types of graph edges can be weighted. You can also have tri-partite and other higher order graphs of this type.
Finally, it should be noted that it is possible to have relationships between relationships. This significantly reduces edge proliferation in certain instances. For example, consider the graph of a nuclear family. There are two parents and, let us say, four children. In a conventional graph there would be six nodes and fifteen edges (everyone has a relationship with everyone else). If you can have relationships between relationships, then you could represent this by seven nodes (the additional node defines the “family” relationship) and just six edges. Thus this approach costs one node but gains nine edges, it can therefore be significantly more efficient. The downside of supporting relationships between relationships is that they are much more complex for users to understand and more difficult to visualise. The same applies to relationships that span more than two nodes.
Databases that support relationships between relationships as well as entities are usually referred to as “associative databases” there is also a type of graph called a hypergraph which allows you to have one relationship connecting multiple entities, which has much the same effect as using an associative database. Several of the latter have been brought to market and there are currently two instantiations of this technology that we know of. There are also a number of vendors that have built software solutions that leverage but do not expose associative techniques and there is an ongoing US Navy project to develop an open source associative database. However, for the moment, associative databases remain a minority interest, while hypergraphs (we don’t know of any commercial implementations) are of academic interest only.
There are three major reasons why graphs are important: visualisation and capability, performance, and management. We will discuss each of these in turn.
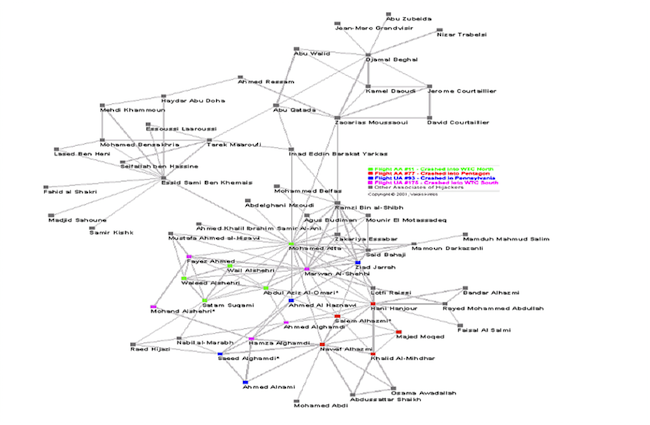
Cognitive research suggests that graphs are conceptually easier for humans to grasp, as a way of understanding connections and causes. More specifically they allow you to discover relationships that you don’t know about, and then to express relationships that are not easy to define or understand when using traditional technology, especially when there are many-to-many relationships, as discussed in the previous section. An example is provided in Figure 4, which shows the relationships between the 9/11 terrorists.
Another example of the ability to discover unknown relationships is in medical research. There are so many research papers published each year (and this applies to all areas of research, not just medicine) that it is impossible for individual researchers to keep track of them all. Because of that, synergies between different groups of researchers can easily be missed. Graph databases can and are being used to discover relationships in this area, which can lead to new drug discoveries or that a drug developed for one purpose may be efficacious in other areas.
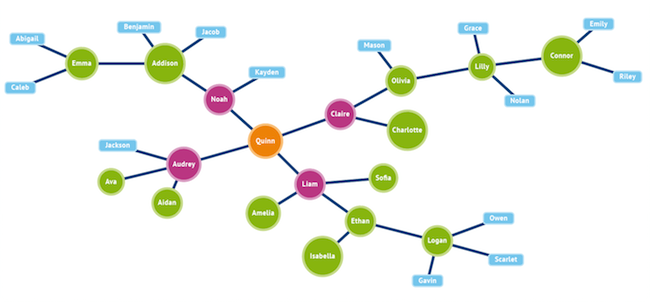
A further issue is that graph visualisation techniques can make the exploration of data much simpler, even when relationships are one-to-many or many-to-one rather than many-to-many. An example is shown in Figure 5. At this point it is also worth introducing the concept of “degrees of separation”. This is basically a count of the number of relationships you have to go through to go from one entity to another. For example, Emma is separated from Quinn by three degrees and from Logan by six degrees.
Note the colour coding that can be derived from relevant attributes associated with each node. It is also worth commenting at this stage, that all queries (though graphs are not only used for queries) are about following or traversing relationships. Even a classic OLAP (online analytic processing) question such as “how many shirts of this colour did we sell from each of our stores last month, by region” can be defined in terms of entities and their relationships. In this context the more dimensions that are involved the more likely it is that a graph-based approach will be advantageous. Further, what you can do with graphs is to extend these sort of questions to include the relationship between customers and products and then to determine such things as recommendations. For example, Wal-Mart is using graphs for just this purpose. Similarly, a number of companies have built mobile applications to recommend such things as restaurants (combining graphs with spatial data) and movies.
There is also the use of graph algorithms. A common example is Dijkstra’s algorithm, which finds the shortest distance between two vertices, taking into account any weightings that may apply. This can be useful for logistics purposes, for example when shipping goods from Dunwich to Maldon (see Figure 2) but also to calculate how long it will take to move from one particular vertex to another, which is useful both in social influencer analysis and in calculating the rate at which diseases spread. In fact, Wikipedia lists some 97 graph algorithms and a number of these have been implemented by vendors to support particular commercial and scientific activities.
Finally, one further analytic capability of graphs is the ability to analyse and predict change. Because you can apply graph algorithms to the transmission of information across the graph you can predict how a change will propagate. For example, suppose that the mortgage on a property in a particular area is foreclosed, then you can predict the effect that this will have (downwards) on the values of other properties in the area. The same applies to stock market trading, vendor pricing on the Internet (they all watch each other’s prices) and a variety of other environments where these sorts of ripple effects are relevant. With appropriate technology you can, of course, simulate such changes.
Inferencing is the ability to make deductions about the meaning of data and to extend your graph automatically as a result. For example, suppose you entered the details “Philip owns a Mercedes” where “Philip” and “Mercedes” are both entities and “owns” is a relationship. An inference engine can deduce that Mercedes in this instance means a sort of car whereas in the example of “Juan is married to Mercedes” it would deduce that Mercedes is a person. Other examples would include inferring that Mary is the daughter of Jane if you have previously defined that Jane is the mother of Mary. In other words, you do not necessarily need to instantiate both relationships. Similarly, if A contains B and B contains C then you do not need to materialise the relationship that A contains C. Thus the graph can be enriched automatically by a knowledge of semantics. If you contrast this with the inability of a relational database to understand anything it isn’t explicitly told, then you should be able to see the potential advantages.
Because you can apply graph algorithms to the transmission of information across the graph you can predict how a change will propagate.
The other major reason why graphs are important is that they perform much better, for relevant tasks, than relational database technologies. However, it depends what queries you are running against which graph databases and at what scale. In operational environments our experience of relational databases is that they can cope with up to about three degrees of separation between entities (depending on the size of the dataset and how densely connected it is: three degrees may be an overestimate) but beyond that performance starts to drop off rapidly, whereas graph databases can cater for up to six or seven degrees of separation or more (in the hundreds with low densities) while still performing well. The main (but not the only) reason for this discrepancy is that many graph queries involve self joins, something which relational databases are not good at.
Consideration also has to be given to the types of query you are running. For example, the PageRank graphing algorithm is used to assess the relative importance of web pages by looking at the number and quality of the links to each page. This is a graph problem. However, if you store edges and vertices as separate tables in a relational database then a traditional, massively parallel data warehouse may perform well because conducting joins and table scans are something that data warehouses are optimised for. This will be especially true if the warehouse implements a bulk synchronous parallel (see later) architecture that has been designed to handle the iteration necessary in an algorithm such as PageRank. On the other hand, if you are looking for terrorist plots you want to know who knows whom, who bought fertiliser, who hired a truck and who has been seen visiting sites of national importance, and so on, so this is a tough many-to-many problem and relational database technology will fall down, not least because it doesn’t know the edges (relationships) it needs to store. Of course there are lots of graph problems between these two and users should run their own proofs of concept using their data against problems that they want to solve. We would typically expect at least an order of magnitude performance improvement between a graph product and a relational database performing the same task, given that this is a genuine graph problem. Note that graph algorithms should, preferably, be customisable.
You can create a “data lake”, including both structured and unstructured data, and perform data discovery against that data much more easily than might otherwise have been the case.
There is also an important corollary with respect to managing relationships within a database. Graph databases tend to be about relating individual data elements while relational databases are focused on relationships between classes of data. This has important implications because it means that when there is an exception in a relational database you have to change the database schema and that may have various implications for applications and other constructs. In a graph database, on the other hand, it is merely a question of adding a new relationship or appending new labels to relevant nodes. In this respect graph databases share the advantages of other schema-less NoSQL databases. This is perhaps a more significant benefit than it might appear at first sight: it means that you can create a “data lake”, including both structured and unstructured data, and perform data discovery against that data (which essentially means developing relevant schemas) much more easily than might otherwise have been the case.
In practice there are two main types of database in this market and one of these types has two major, and several minor, sub-types. The different approaches are:
As the name implies, these tend to be focused around operational use cases, though at least some analytic capabilities will be included. These databases are sometimes referred to as navigational graph databases. There are two major approaches:
These are usually referred to as graph databases. Some implementations include labels, some do not.
These take a semantic (subject-predicate-object) approach based on W3C standards. These are also sometimes referred to as triple stores. Some vendors of triple stores support properties in a similar way to graph databases. Further, some products are based on what are known as quad stores where the context (name of the graph) is also stored.
There are relatively few vendors that focus specifically on analytics. Implementations (see next) vary between those specialising specifically on graph problems and those that use graphs to augment more traditional analytic techniques. RDF databases tend to be strong when it comes to text analytics and search.
One further distinction that needs to be clarified is with respect to the difference between transactional and operational databases. Virtually all graph databases are ACID compliant. However, by no means all support immediate consistency. In turn this means that some products may be suitable for operational but not transactional purposes. Specifically, there is an issue when it comes to the “graph layer on NoSQL option”. This is that this option has significantly different “data trustworthiness” characteristics compared to a native graph database when backed by a sharded or eventually consistent back end. As an example, when you take a graph unit of work and apply it to a database designed to handle column family sized units of work, the graph unit of work gets broken into multiple column-family units of work, each of which may or may not succeed, and each of which may propagate across the cluster at a different rate. This can result in steady and inevitable corruption. While some of this can be repaired using offline batch methods, some of it can’t. For instance, there is the issue of “ghost vertices”, which occurs when a node is simultaneously modified and deleted by different transactions and the result is a hanging node with only the modified properties. Thus graphs on top of NoSQL solutions can be unreliable for transactional purposes and for operational environments (such as fraud detection) where data needs to be reliable in real-time.
In addition to different types of database there are also different ways in which graph and RDF databases have been implemented. The options include:
Before we discuss the types of technology you might use to support graphs, it will make sense to discuss the various types of use case that are best suited to graphs. This is because certain architectures for graphs are more useful for some use cases than others. Broadly, we can define the following categories of use case:
A common use case in this category is in master data management (MDM) and in support of many-to-many environments such as bills-of-materials. MDM, in particular, often has this same many-to-many requirement where you have complex product hierarchies that are difficult to traverse efficiently when using a relational database; or where there are complex relationships between your company and clients or suppliers. For the same reason, 360º view applications (360º view of the customer or product or patient or prescriber, and so on) are also increasingly common. Reference data management (which tends to be semantically oriented – see next) is similar, in that it is too structured for NoSQL environments but too diverse for SQL-based approaches. Other major use cases include identity and access management, cybersecurity, recommendation engines (next best offer), digital asset management, fraud detection, and geolocation applications such as logistics and routing.
Pretty much all graph databases support analytics. However, the type of analytics supported varies widely.
Natural language is based upon subjects, verbs and objects with adverbs modifying verbs and adjectives modifying nouns (subjects and objects). There is a simple parallel between this and graphs (entities = nouns, relationships = verbs and so on). More specifically, the resource description framework (RDF), which is a W3C standard, is the underpinning for the semantic web and also the lightweight version of this known as Linked Open Data (sometimes just Linked Data or Open Data). RDF uses what are known as “triples”, where a triple consists of two entities and a relationship defined between those entities (technically: “subject-predicate-object”). Triples are used to understand and leverage the relationships that exist between different resources available across the Internet as well as in other environments, especially where vocabularies, ontologies or taxonomies are in use. For example, a significant number of media and publishing companies use RDF technology, often in conjunction with search engines such as SOLR, Lucene or Elasticsearch (which is based on Lucene). Data integration and compliance monitoring are common applications, especially when both structured and unstructured data is involved. There are a number of relevant use cases in the financial services and healthcare sectors. It is also worth commenting that some RDF databases are targeted more at text processing and text analytics than semantics per se.
Pretty much all graph databases support analytics. However, the type of analytics supported varies widely. Some are better suited to operational analytics while others are more oriented towards batch processing in what we might think of as a data warehouse. In addition to this level of differentiation we can also (thanks to Donald Rumsfeld) identify three types of analytic problems at which different graph products are targeted:
Here we know about entities and their relationships but we want to explore that information further. A good example of the former are the recommendation analytics already quoted: the relationships between customers and products is known, now we need to analyse how to use this information. Another example would be influencer analytics. The graphing algorithms previously referred to typically fall into this category.
Here we know the entities but need to identify and then analyse the relationships between them. A good example is in insurance fraud. Or, for that matter, telecommunications or benefits fraud. It is often the case in these environments that people committing fraud are known to one another or are related or share common phone numbers or addresses or credit card numbers or where the same set of people were involved in the same car accident. So, what you want to do is to identify who knows whom so that if you are suspicious about one person you can find out who else you ought to be suspicious about.
Here we don’t know either the entities we are interested in or their relationships. This is a classic “data lake” issue where you want to explore for potential relationships between entities and you’re not even really sure which entities you are interested in. In other words, very much a discovery process. Examples of use cases here include research of various kinds (finding relationships between published research papers or across legal documents), the investigation of potential terrorist plots and the discovery of cyber threats, amongst others. Analytics in this category is often within the realm of what is otherwise known as cognitive computing.
Some vendors in the graph database market are competing in the cognitive computing market. There are various ways that this can be achieved but one notable method is to be able to attach a probability to the edge of a graph.
There are some graph vendors that do not focus on any of the preceding use cases but instead concentrate upon providing what is sometimes known as a “unification platform”. That is, a database that sits as a middleware layer over and above existing relational and non-relational data stores that can act as a virtualised query platform that spans those various sources. As a true database some of the underlying data may be moved into the graph database using conventional ETL processes but most such information is retained in situ. The big advantage that graph databases have in this environment is that the relationships between the different data sources and the data they contain, are directly expressed and understood through a graph of the environment.
There is a growing OEM market for graph and RDF databases with IT vendors embedding graph products in order to both support and visualise complex relationships. In addition to use by companies engaged in semantics there are also a significant number of vendors in and around data governance (including MDM, matching engines, and data profiling as well as data governance per se) that have embedded graph products. The same true is for self-service data preparation platforms and metadata management.
Multi-model approaches may allow a single query to span multiple types of data as well as graph: for example, combining graph, relational and text analytics into a single process.
Finally, it is also worth commenting that multi-model databases can have advantages when it comes to analytics, compared to pure-play graph databases. The latter simply handle graph problems. However, multi-model approaches may allow a single query to span multiple types of data as well as graph: for example, combining graph, relational and text analytics into a single process. In addition to vendors offering this directly this is also the promise of open source projects such as Apache Spark.
We have already considered the relative performance advantages of using graph technology as opposed to traditional query methods. However, there are specific performance considerations that relate to different graph products.
Where the use of indexes is minimised graph databases should perform optimally in transactional environments, because extra indexes involve more writes, which can be a hindrance to good performance.
One of the distinguishing features between RDF databases and property graphs is that the latter employ index free adjacency. What this means is that you can traverse from one node to an adjacent node without needing an index. If index free adjacency isn’t supported, then you do need an index. However, this doesn’t mean that you don’t need any indexes and most vendors offer either primary and secondary indexes or index free adjacency and secondary indexes. In fact, different vendors have pursued different strategies as to the extent of additional indexes (and their type) that they have implemented. Property graph databases get the relevant performance benefits when handling pre-defined queries but can leverage adjacency free indexing for ad hoc queries where pertinent indexes have not been defined. More comprehensive and/or sophisticated indexing will get you better performance for relevant queries but, of course, suffer from the same issues that indexes always bring: increased administration and slower writes. Where the use of indexes is minimised graph databases should perform optimally in transactional environments, because extra indexes involve more writes, which can be a hindrance to good performance.
As far as performance goes there is a further problem with graphs that we have not yet discussed. This is that it is difficult, and in some cases impossible, to know how to shard, partition or co-locate data in order to get best performance out of the system. While this is less of a problem for known knowns it is certainly true where you don’t know about the relationships between entities in advance. The problem is exacerbated by the fact that many graph problems involve (often multiple) self-joins whereby it really doesn’t matter whether you can co-locate data or not, because you are still going to have to join across the network. Vendors that can overcome or limit the problems caused by these issues will be well-placed as users seek to extend beyond known-known queries into unknown environments, which is something we expect.
Different vendors have adopted different approaches to handling this problem. Most common is to provide traditional methods such as MPP (massively parallel processing) and/or substantial in-memory capabilities. However, two alternate approaches are worth discussing.
The first is to use a Bulk Synchronous Parallel (BSP) architecture. This is an architecture for supporting parallel processing. Where it differs from traditional approaches is that it treats messaging (between each of the parallel threads) and synchronisation of those messages en masse rather than as individual elements of the system. This eliminates dependencies and means that each iteration within a process is only limited by the slowest vertex (that is, the busiest vertex with the most edges). In practice, BSP significantly improves performance for iterative graph processing. It is noteworthy that the open source Apache Giraph and Apache GraphX (Spark) projects are both based on BSP.
The second approach worth mentioning is leverage of graphical processing units (GPUs) to improve performance. The key to remember here is that it is certainly true that GPUs can significantly improve performance for relatively low cost. However, GPUs have relatively small memory capacities (a few Gigabytes) so the use of GPUs will be most appropriate either where the size of the data is small (within the capacity of a single GPU) or, more particularly, where the query can easily be parallelised across multiple GPUs. There are certainly some graph algorithms for which this is true though there are others for which that is not the case.
It is difficult, and in some cases impossible, to know how to shard, partition or co-locate data in order to get best performance out of the system.
Semantic inferencing, as provided by RDF databases, can be very useful within analytic environments. For example, in the pharmaceutical industry you might want to ingest various data sets (protein, chemical, genetic and so on) and want to be able to combine them via application of “same as” (which is an inference construct), whereby you can recognise that Molecule A is the same as Molecule B in another data set but which may have a different identifier, so that you can quickly execute more efficient and complete analytics.
However, there are potential issues with inferencing. There are, in fact, two major types of reasoning that may be provided: forward chaining and backward chaining. The former starts with the data and then calculates a result while the latter states a desired result and the software works backward to the necessary data. Both methods have issues: forward chaining materialises inferences which impairs performance for updates and deletes. There may also be an issue with respect to what is known as “retraction”, which is the process of removing materialisations that are no longer required. In addition, user access control can also be more complex to implement when using forward chaining. Conversely, backward chaining can either (depending on the method used) lead to query processing that is difficult to optimise or to a proliferation of sub-queries, either of which can seriously impair query performance. On the other hand, because inferences are not materialised, any costs are only associated with a particular query as opposed to being across the entire environment. You will want to ensure that the vendor you select to provide your database has put appropriate measures in place to at least ameliorate these issues.
Depending on the product you can use a huge range of traditional programming languages such as Java, C, C++, Python and so forth, alongside your graph database. In addition, a number of the semantically oriented graph products support OWL (web ontology language). However, the most popular and/or important access methods are specific to graphs and these are typically declarative.
Depending on the product you can use a huge range of traditional programming languages such as Java, C, C++, Python and so forth, alongside your graph database.
SPARQL (SPARQL protocol and RDF query language), which is a W3C standard, probably gets the most press of any language developed specifically for graph processing, though whether it is the most widely used in practice is debatable. It is most commonly used alongside purpose-built RDF databases (including those re-branded as graph databases) but not so much when these have been built on top of other technologies. As a language it is SQL-like in that it supports joins, selects, groupings and so forth but it also introduces PATH primitives for graph traversal. Thus SPARQL is a declarative language. However, it was designed originally to be used to query RDF databases and makes certain assumptions about semantics that may not be applicable to all (property) graph instantiations. In addition, of course, you need a database optimiser to make any declarative language perform well and this is not always a strong point. There are already numerous extensions (notably to support SQL and X/Query) and versions of SPARQL, just as there are with SQL. One particular drawback of SPARQL is that it does not support, for example, the concept of a time stamp associated with a triple.
There are two other declarative languages that we are aware of. One is KEL (Knowledge Engineering Language), which is a proprietary language that runs against an open source database, and the other is Cypher, which is an open source language that is only licensed for use with a proprietary but open source graph database. Both vendors provide a database optimiser that has had some significant development put behind it. There is also at least one vendor that has extended SQL rather than implementing a new declarative language.
With respect to SQL, it is possible to front-end graph queries with SQL even if you are not actually doing any processing using SQL (it is translated under the covers). The big advantage of this (as well as direct SQL implementations) is that you can use traditional (relational) BI tools to support your query processing. SQL can also be combined with MapReduce.
Alongside the various open source graph projects from Apache there is also TinkerPop. This was originally created by a developer group building an open source stack targeted at property graphs. However, TinkerPop has now been donated to Apache and it has become one of that organisation's projects. While the latest instantiation of TinkerPop (TinkerPop 3) consists of a single holistic environment it was previously comprised of several sub-projects and it is worth detailing these because it will give a better understanding of what is involved. So, previously, there were six “products”, of which the foundation module was Blueprints. This is an API that is analogous to JDBC but for property graphs. Running in conjunction with this are Pipes, which is a dataflow framework; Frames, which exposes elements of a Blueprints graph as Java objects; Furnace, which is a graph algorithms package; Rexter, which is a graph server which includes a REST API; and Gremlin, which is a graph traversal language.
With respect to SQL, it is possible to front-end graph queries with SQL even if you are not actually doing any processing using SQL (it is translated under the covers).
Blueprints is supported by a wide range of suppliers that offer property graphs and Furnace means that any suitable database vendor can support (customisable) graph algorithms. Gremlin is especially interesting because it is what one might describe as a quasi-declarative language. That is to say, it has elements that can be treated as declarative but other elements that are more procedural. What the former means is that you can build (and some vendors have) database optimisers around, for example, path expressions, so that you get at least some of the sorts of performance and ease-of-use benefits from using a declarative language.
Finally, it is worth commenting on standards. A number have been mentioned in this paper but we need to clarify a few points with regard to several of these. Specifically:
One final point that is worth discussing is how you create your graph database in the first place, on the assumption that the data to be used within the graph previously exists in some other format. To a certain extent the answer to this issue depends on what that format is or was. Typically, the data will either be relational or it will exist in a document or some other form of unstructured media.
…the biggest issue here is simply the amount of processing that is required and the time involved.wa
As far as relational data is concerned there is W3C project called RDB2RDF, which consists of two recommendations, one called Direct Mapping and the other known as R2RML (relational to RDF mark-up language). The former does what its name implies and maps directly from a relational schema to a corresponding RDF schema. The latter is more flexible in that the shape of the resulting graph is not pre-determined by the original relational schema. Because of its flexibility our impression is that R2RML is the more popular of these approaches. These products can also be used to create virtual graph views that allow relational data to be accessed via SPARQL while in situ. Note that these languages have been specifically designed to support RDF rather than property graphs. For this reason, some suppliers of property graphs have developed their own mapping and ETL capabilities.
If data already exists in documents and content management systems, then different issues arise. This is where the use of ontologies and semantics comes into play, to parse text, find keywords and identify relationships. Apart from the creation of appropriate ontologies – or, more likely, the customisation of existing ontologies (which are widely available) – the biggest issue here is simply the amount of processing that is required and the time involved. As a result, we are starting to see graph vendors adopt the use of Hadoop for this pre-processing.
Graphs and graph databases are becoming increasingly popular because they allow certain query types to be formulated, processed and explored much more efficiently than when using traditional technologies, especially once you get up to and beyond three degrees of separation. While there are also a number of operational processes that can usefully deploy graphs, the technology’s main strength is in supporting data and text analytics and/or discovery (including eDiscovery). Most commonly, operational requirements, if deployed, will be combined with analytic elements.
Depending on the type of requirement you have, you may need to explore different graph options: not all graph products are suitable for transactional environments and not all have the architecture necessary for advanced analytics against large datasets. There is also a choice to be made between databases that natively store graphs and those that have a graph layer on top of a different physical architecture. The former are likely to provide better performance, and will typically be more reliable when updating data storage, but the latter may provide additional capabilities not related to graphs. As always, these are generalised statements and you really need to conduct proofs of concept (POC) to determine performance and capability to suit your business requirements. In particular, graph products do not necessarily fit into the neat little categories we have defined in this paper. For example, a number of what were RDF databases have added support for properties, while vendors that previously focused only on operational processes are extending their capabilities to support more advanced analytics. Not surprisingly, demarcation lines are blurring. In any case, appropriate research will be needed before even getting to the POC stage.
We therefore expect continuing growth and popularity in this market: it resolves real problems that cannot be satisfactorily answered through traditional approaches.
Unlike other new database approaches, graphs cannot easily be subsumed by the leading relational database vendors because the architectural constraints of graphs do not fit easily within the relational paradigm. We therefore expect continuing growth and popularity in this market: it resolves real problems that cannot satisfactorily be answered through traditional approaches.
This spotlight report was brought to you in partnership with the software analyst firm Bloor. Click here for more information on Bloor, here for more content from Crozdesk and here to start a software search.