Piktochart is an all-in-one tool for creating professional-grade infographics, presentations, reports, and prints in less than 30 minutes.
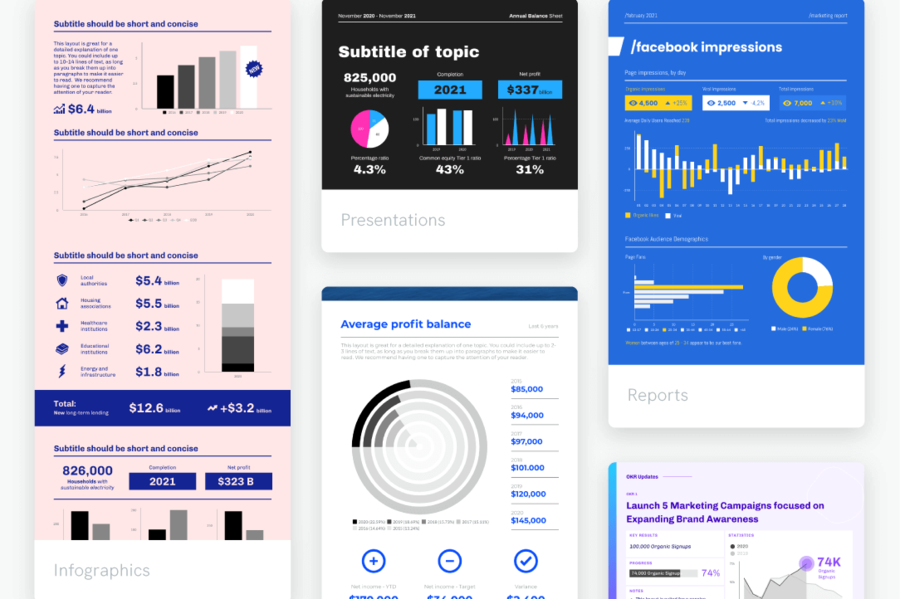
Piktochart is an all-in-one visual communication tool for creating stunning reports, presentations, infographics, social media graphics, and prints. With Piktochart, you can easily turn any text- or data-heavy content into a visual story that your internal and external audience will love.
Piktochart utilizes HTML publishing capabilities to generate search engine readable infographics, presentations, reports, or posters and user clickable elements, forgoing the need to hire designers and developers to create high quality, interactive visuals.
Piktochart can be used for free giving access to thousands of templates for users to choose from. Pro users can benefit from additional image storage, unlimited downloads, brand assets, and more.
Piktochart has been used by over 8 million users around the world.
Piktochart currently scores 92/100 in the Infographics / Charts category. This is based on user satisfaction (91/100), press buzz (70/100), recent user trends (rising), and other relevant information on Piktochart gathered from around the web.
| The score for this software has declined over the past month. What is this? |

Editors' Review by the Infographics / Charts Software Review Team
Piktochart is a cloud-based infographics solution. It offers users a simple yet intuitive tool that allows them to create content with high-quality visuals.
Piktochart is a user-friendly and intuitive infographic tool, presentation software, poster, flyer and visual report maker. It is designed to help users, marketing teams, storytellers and other professionals to communicate their message and tell their stories in an engaging and visual way that has a significant impact on their target audience. While the tool is designed for ease of use, it is still able to provide users with a wide variety of unique functions and capabilities. The software doesn’t require much training or extensive experience to allow users to create professional-looking presentations and infographics.
You can use Piktochart to create a broad range of visual-centric content, from flyers, posters and presentations to professional and business reports and infographics for your website, social media page or personal blog. The fact that this cloud-based infographics tool is easy to use makes it suitable for both beginners and professionals. Piktochart is also ideal for businesses and organizations of any size. It works well with both Windows and Mac operating systems.
The online software lets you utilize and take advantage of interactive charts and customizable maps. You only have to import your data or numbers, pick a chart or a map that you like and then you can either customize it to suit your message or leave it as is. Piktochart also gives users full access to an extensive library of cool images and icons within the editor. If you can’t find any image or icon that you like, the tool also allows you to upload or import your own graphics and images. The icons require no attribution and additional fees.
Piktochart not only allows users to create professional-looking infographics, but also lets them create and design their infographics with SEO integration to help make sure their content is promoted and easily found in any of the top search engines. The cloud-based software also offers sharing options that give users the ability to share or publish their content at any time they prefer. Through Piktochart’s presentation solution, users get to customize their charts and interactive maps, allowing them to deliver more impactful and data-driven visual stories and messages.
There is also a built-in presentation mode that gives users the power to present their created visual content in the form of a slideshow, much like how Windows Slideshow and Google Slides work. With Piktochart’s presentation module, marketing professionals and teams have a robust and easy-to-use platform that they can use to drive traffic to their pages, increase brand awareness, improve customer engagement and boost their leads and lead conversion rates.
Piktochart is equipped with a decent set of features and tools that are tailored to facilitate the creation of beautiful and engaging graphics, posters, flyers, presentations, charts and other masterpieces. Users, regardless of their skill level or expertise, can easily create their own infographic and other visual content within minutes of logging into the cloud-based solution.
Some of the core features of Piktochart include ready-to-use graphics, customizable maps and interactive charts, design flexibility, functional innovations and high-resolution downloads. Anything that a graphic designer or marketing professional needs to create stunning infographics, marketing materials, printable posters and flyers, detailed reports and engaging slides for their presentation is readily available and provided by the service. The following are a couple of Piktochart’s other features and offerings:
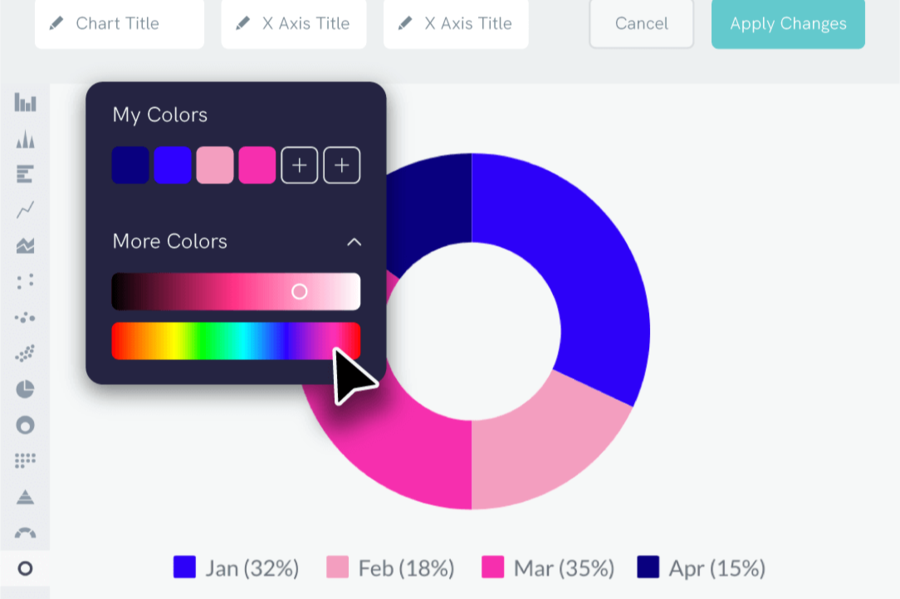
Piktochart allows users to customize their projects to match their branding with the entire process done within seconds. All they have to do is simply drag their company logo or a screenshot of their business website onto the template, and the system will automatically adjust the color schemes of the template to match the colors of the logo and/or image. Fonts can be customizable as well. The software will even allow users to upload their custom color palette and fonts, which can be accessed through the graphic editor.
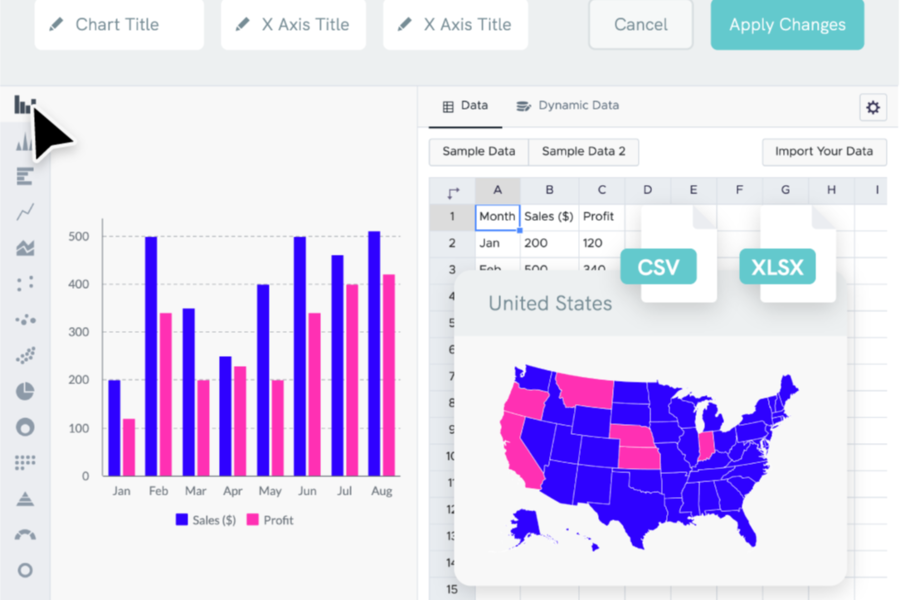
Using Piktochart to create detailed reports and visual presentations is also possible with the software’s robust maps and charts, which are interactive and fully customizable. The tool gives users the ability to easily translate their data into engaging and easy-to-digest visual stories. When done properly, the graphics that can be produced will have the potential to grab the attention of the audience and give them a better understanding of the data being presented.
The cloud-based software also supports Google Sheets and Windows Excel files, allowing users to easily upload data that are saved in Google Sheets or Excel formats. The system can easily create a graphical representation of the linked data, which automatically updates whenever changes or modifications are made to the data in the original file. Users may then incorporate interactive maps to their report or presentation in order to highlight the key points they’re trying to drive home to their audience.
Piktochart is equipped with tools and features that are tailored for all types of users, regardless of their expertise or experience with any kind of graphic design software. It empowers graphic designers as well as marketing professionals to design and create their very own infographics, creations that are stunning, engaging, publisher-ready and can stand alone as a rich source of professional quality multimedia content.
This all-in-one graphic design and visual presentation software offers quite an impressive HTML publishing capability, which is considered by industry experts as the driving force behind good quality web-based visual infographics. The following are some of the benefits of using Piktochart as a visual content maker:
Piktochart’s features and capabilities are quite good, comparatively speaking. It comes with a toolkit that helps users create professional-looking infographics for different platforms, including websites, social media pages and blog posts. The customizable maps and interactive charts, free icons and configurable canvas make for a robust design toolkit that anyone can use. The cloud-based solution also allows users to embed high-quality videos, links, charts and maps with relative ease. The software offers an HTML publishing tool that easy to use and implement.
Most novice users and budding designers will most likely find Piktochart’s rich design toolkit very user-friendly and a joy to use. For professional graphic designers, they may find that Piktochart is a good addition to their current studio.
Piktochart supports a wide variety of platforms, from business websites and personal blog posts to social media pages, reports and presentations. Besides the different platforms that it can be used for, Piktochart can also serve as a visual aid creator for offices, nonprofit organizations, schools and other learning institutes, healthcare facilities and so on. Users are able to choose the output file format to anything they prefer, including PDF, JPG and PNG, making it possible to share their work in an easy and efficient way.
While a lot of professional graphic designers enjoy using Piktochart and make it a point to add the software in their toolkit, this cloud-based infographic maker is tailored for novice users and beginners. Users who are just beginning to dip their toes in the world of graphic design will benefit the most from this software solution. Piktochart has a very intuitive interface that is meant to provide fast and easy navigation.
Piktochart also offers a broad range of templates and themes to facilitate the graphics creation process for beginners. However, these templates can be fully customized to match the branding of the company, which is beneficial to both novices and professionals. The software can easily adapt to the skill level and skill set of the person using it.

Piktochart has three pricing packages available: Free, Pro and Team. The Free plan is free forever. It is suited for beginners looking to hone their visual communication skills, but don’t want to invest in a premium package just yet. The Pro package is a good fit for professionals who are looking for an affordable, efficient and scalable way to manage their brand and visual communication activities. The Pro plan starts at $29 a month or $24.17 for annual billing.
The Team package, on the other hand, is ideal for teams with more than a couple of members. It offers collaboration tools, team sharing, team templates and single sign-on (SSO) functionality. Pricing for this package starts at $26/month for the monthly billing option and $21.67/month for the annual billing.
In addition to the standard pricing packages, Piktochart also offers special pricing plans for education and nonprofit organizations. Both Education pricing and Nonprofit pricing are the same, with a Pro package and a Team package available for customers to choose from. All pricing plans in both Education and Nonprofit are billed annually. The Pro package starts at $39.99/year and is tailored for individual users. The Team package starts at $199.95/year, good for up to five seats.
Piktochart is an easy-to-use, cloud-based visual content maker designed for professionals and beginners alike. It can be used for creating infographics, presentations, reports, posters, flyers, social media graphics and more. It can be used by individuals new to the world of graphic design, professionals looking to add to their graphics toolkit and teams that are working in nonprofit organizations, the education sector, finance, marketing, human resources (HR) and other industries.
Make professional grade infographics, presentations, reports, and posters in ~30 minutes
Save time by organizing and repurposing content
Collaborate on visual projects with your team
Visualize your data with maps and charts
Customize to your brand in seconds
Download in PNG, PDF, PPT
Start for free and upgrade when you want
Yes, you can invite additional members to your collaborative workspace in Piktochart. Once you invite your teammates, you can create, organize, and edit visuals together. If you need a second pair of eyes on a visual you are working on, share it with your workspace members and gather feedback through comments.
Professionals who need to create visual communication for either internal or external use, and who don't have time to use complicated design software.
Yes, you can find video tutorials here: https://piktochart.com/piktochart-tutorials/
We also offer customer support over email and chat.
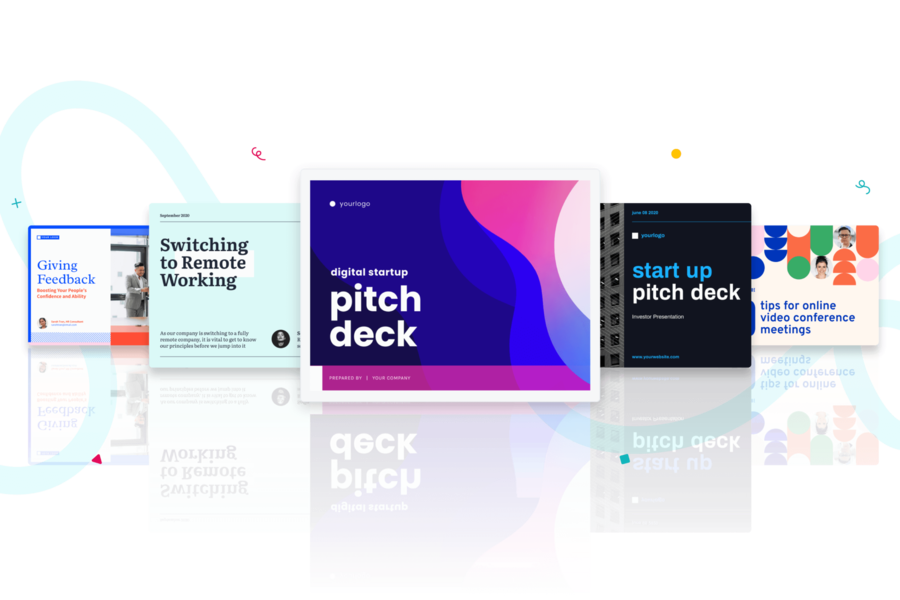
Piktochart is the all-in-one visual communication tool for an easy creation of infographics, presentations, reports, posters, social media graphics, brochures, pitch decks by non-designers.