
Opvizor Performance Analyzer refers to a performance monitoring product catered towards VMware vSphere, VMware vSAN and VMware VCSA environments.
Before diving into Opvizor, users need to understand how VMware functions. With promises of the right cloud, the right network and the right experts, VMware vSphere, for example, accelerates your business’s ability to perform in the hybrid cloud. Companies and organizations alike can manage, connect, run and secure their applications in a single, operating environment across different cloud systems. Some of VMware’s top features include enhanced app performance, virtualized big data and data center consolidation.
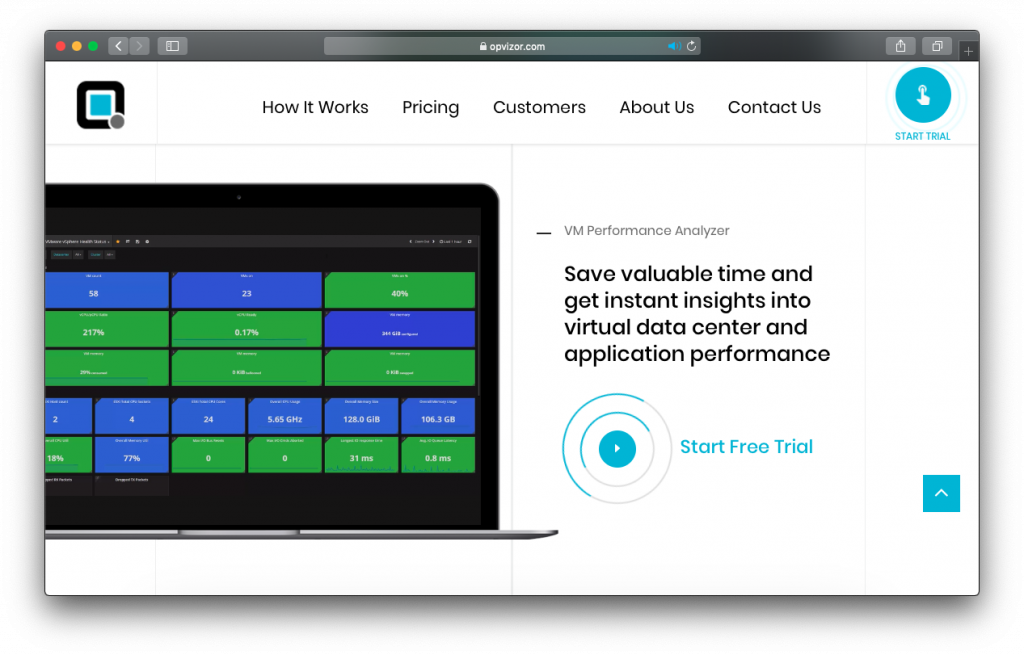
This is where Opvizor Performance Analyzer comes in. Its entire system is focused on highlighting details about your infrastructure, which makes changes easier to track and streamlines the troubleshooting of any underlying issues. It constantly and continuously collects data from the applications integrated with VMware and later displays them into a clean and easy-to-understand display. Metrics include the number of host licenses, licensed hosts, monitored hosts and licensed days.
When using Opvizor Performance Analyzer, users will find that its local navigation layout is similar to the Grafana open source project—which it uses as it’s dashboard engine. On top of the screen, you’ll see a list of items for you to work with. These include Additional Navigation, Current Local Navigation, Favorites, Share Dashboard, Cycle View and Refresh Data. Meanwhile, the left side of the screen is where you’ll find items under local navigation.
Opvizor Features
Infrastructure health
Opvizor provides data on your infrastructure’s health by displaying vital metrics such as real-time performance analytics as well as current, historical, and predicted future statistics. Businesses can easily stay on top of their applications and virtual machines through the solutions intuitive interface that lets users know how exactly well your infrastructure at any time.
Performance bottlenecks
Bottlenecks can harm your business if left unattended. They disrupt your computer or even your server, which affects the entire system. To avoid this, Opvizor Performance Analyzer lets you find bottlenecks with its easy-to-understand dashboards, pre-defined thresholds and embedded help.
Capacity planning
Capacity planning refers to planning out your VMs and ESXi hosts. To have an efficient and well-oiled system working for you, you need to ensure your resources are managed effectively. With this feature, you can eliminate the risk of redundancy and ensure you’re following the usage trend. This also guarantees your resources aren’t wasted and your virtual machines aren’t overbooked with tasks.
Visual warnings and alerts
Getting visual warnings and alerts is helpful in making sure you are updated on all important details and data. Information about the current, average and maximum values of your KPIs will ensure your entire infrastructure runs smoothly.
Change tracking
This feature helps you track VM hardware and configuration changes related to your infrastructure. Since your infrastructure is based on several virtual machines, being updated with its changes can help improve your overall performance. Any changes such as additional memory, CPU limitation or even a network change, can be tracked by the system.
Event and performance correlation
Users can merge events and performance data to come up with a computing stack. This lets you know the inner workings of the ESXi and virtual machine. Within a single chart, you can understand how outside events affect the performance of your applications. Once this feature is activated in Opvizor Performance Analyzer, you’re given a visualized chart to see how they’re directly proportional.
Full-stack view
This feature lets you check the full stack of all integrations with physical network components, OS agents and integrations. Through this, you can compare the overall performance data yourself. These integrations include NetApp, DataCore, Cisco and more.
Opvizor Benefits
Here are the top three benefits of Opvizor Performance Analyzer:
Improved performance and productivity
Having a visual representation of all processes related to your VMs can drastically improve the way you manage and administer your business. When using Opvizor Performance Analyzer, you’re given an all-in-one monitoring solution to work with. This helps easily you know which machines or applications are the most successful, especially as the solution enables users to monitor VMware vSphere, VMware vSAN and VMware VCSA environments from a single location.
Interactive dashboard
The dashboard is one of the best features of this system as you can view all details related to your virtual machines. You can get the specifics of VMware capacity, performance, statistics and health status. Additional features include being able to check all versions or dashboard history.
Powerful integrations
Opvizor lets you work with several powerful integrations to ensure you can get the most out of this solution. Examples are Nutanix Prism Central, Oracle Database, Cisco UCS and Microsoft Windows. You can view a full list of these integrations from the official website.
Opvizor Performance Analyzer Pricing
There is no fixed price for its solution, so you must contact the sales team. Pricing starts at $390 per year but they tailor the system to the needs of your business. A free 30-day trial version is also available for users who want to fully test out Opvizor’s features.
Conclusion
When you work with environments like VMware vSphere, you’re given several tools to work with. But, with the help of Opvizor Performance Analyzer, you can monitor and analyze all metrics related to your data configuration and performance in a centralized and advanced solution. Additional features include tracking changes to your virtual machines and correlating events with guest applications and infrastructure.
This solution is helpful as you can adjust and make changes to your applications with ease. While it can be confusing at first for users with lower technical backgrounds, you can easily customize the system to cut out any unwanted metrics. As such, dashboards and views can be tailored to fit your exact standards and needs. This helps you gather specific performance metrics covering the most critical systems.
At the end of the day, Opvizor Performance Analyzer makes keeping track of the storage, servers, CPU and networking of all your VMs significantly easier.
