Data Visualization Software Buyer Guide 2024


Data visualization software is used to transform data based on key business metrics into insightful visual representations, such as graphs or charts. These solutions generally enable users to create a custom dashboard using drag-and-drop functionality so they can set up the exact metrics they would like to track.
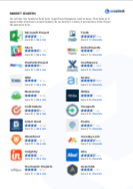
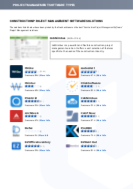
In the data visualization software buyer guide, we will take a look at the market’s top products, important considerations to bear in mind, and other things you should know before choosing a data visualization solution for your business.
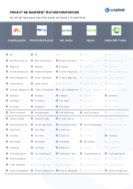
In the Data Visualization software buyer guide you’ll find: