GTmetrix tells you how fast your website is performing and where your site is slow.
Get a summary of key performance indicators
Analyze your page with Google PageSpeed and Yahoo! YSlow rulesets
Get your page's Page Load Time, Total Page Size and Total # of Requests
See your page's performance relative to the average of all sites analyzed on GTmetrix
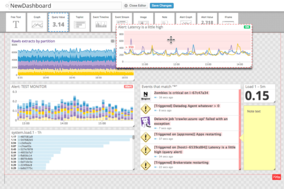
Track performance with monitoring, graphs and alerts
Keep track of page performance with scheduled monitoring and visualize it with interactive graphs. Set up alerts to notify you when your page performs poorly.
Monitor pages and run a test daily, weekly or monthly to ensure optimal performance
Visualize performance with 3 graphs available: Page Load Time, Page Size & Request Counts and PageSpeed and YSlow scores
Zoom, pan and set a date range to find specific performance history
Annotate areas of interest on your graph and give your data context
Set alerts with numerous conditions based on PageSpeed/YSlow scores, Page load time, Total Page size, etc
Test your page from multiple regions
Analyze the page load of your site from 28 servers in 7 different regions around the world: Vancouver, Canada; London, UK; Sydney, Australia; Dallas, USA; Mumbai, India; São Paulo, Brazil; and Hong Kong, China.
Simulate devices, change screen resolution and more with the Developer Toolkit
PRO Bronze, Silver and Gold users get access to our Developer Toolkit, which provides even more advanced analysis options:
Simulate a device to approximate the display of websites on popular mobile devices like iPhones and iPads
Change the Screen Resolution to test your page's responsive layouts
Edit the User Agent string or add a custom DNS for staging/development environments
Create Presets to quickly test with your frequently used options
Also available as an add-on to PRO Custom plans
About Datadog
The main purpose of this platform is to help IT administrators and app operations specialists watch the performance of their apps, tools, and networks. It delivers solutions for increasing agility, efficiency, and visibility of dynamic or high-scale infrastructures.
Users need to install the monitoring agent, which can observe multiple devices and services, such as Windows Services, SQL Server, IIS, vSphere, or Apache. The platform aggregates data coming from different applications, covering their entire life-cycle, and acting as an end-to-end monitoring tool.
Datadog has the capability to provide full information about users' systems, clusters, and infrastructure, whether on-premise or in the cloud deployment. The monitoring can be performed in a real-time manner, or users can create alarms and notifications in cases of threshold or value overpassing.
Features
API
Data Export
Data Import
External Integrations
Multi-User
Notifications
Malware Protection
Bug Tracking
Features
API
Data Export
Data Import
External Integrations
Multi-User
Notifications
Malware Protection
Bug Tracking
Summary
No key features associated with this application.
Summary
Free Trial for an Unlimited Number of Hosts
120+ Turn-Key Integrations for Data Aggregation
Clean Graphs of StatsD and other Integrations
Slice and Dice Graphs and Alerts by Tags, Roles, and more
Outlier Detection for Hosts Behaving Abnormally
Alert Notifications via E-mail and PagerDuty
Alert on any Metric, for a Single Host or an Entire Cluster
Full API Access in more than 15 Languages
Overlay Metrics and Events Across Disparate Sources
Out-of-the-box and Customizable Monitoring Dashboards
Pricing
Bronze
$14.95
1 user(s) / month
Included in plan:
10 Monitored URLs
100 Saved URLs
100 Daily API credits
Priority access (Skip the queue!)
Hourly monitoring of URLs
Remote location monitoring
Developer Toolkit
Silver
$49.95
1 user(s) / month
Included in plan:
20 Monitored URLs
200 Saved URLs
500 Daily API credits
Priority access (Skip the queue!)
Hourly monitoring of URLs
Remote location monitoring
Developer Toolkit
Gold
$149.95
1 user(s) / month
Included in plan:
50 Monitored URLs
500 Saved URLs
1500 Daily API credits
Priority access (Skip the queue!)
Hourly monitoring of URLs
Remote location monitoring
Developer Toolkit
Custom Plan
1 user(s) / month
Included in plan:
Choose quantities and features that suit your needs!
Pricing
Free
Free
Included in plan:
For 1 to 5 Hosts
Core Collection and Visualization Features
1-Day Metric Retention
Discussion Group Started
Pro
$15.00
1 server(s) / month
Included in plan:
Core Features plus Alerting, Custom Metrics, and more
APM Available
For any Number of Hosts
15-Month Metric Retention
Chat and Email Support
Enterprise
$23.00
1 server(s) / month
Included in plan:
All Product Features, Advanced Administration and Reporting
Main users of Datadog are app developers, IT professionals, and other app operations specialists in medium-sized and large organizations.
Does this service offer guides, tutorials and or customer support?
Support: FAQs, Knowledge Base, Online Support, Phone Support, Video Tutorials.
What are some applications this service is commonly used in tandem with?
It is commonly used in tandem with SaaS and Cloud providers.
Does this service offer an API?
Datadog includes full API access to bring observability to all users' apps and infrastructure.
What is this service generally used for?
This service is used infrastructure management and network monitoring.
What platforms does this service support?
Datadog agents are available for a variety of platforms, including Microsoft Windows, Apple Mac OS X, Debian, Ubuntu, Fedora, CoreOS, Docker, Chef, Puppet, and several others.

 view 2 more
 view 5 more