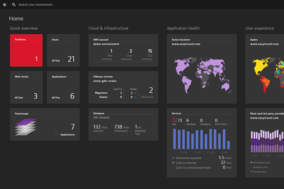
This all-in-one solution provides end-to-end visibility without blind spots.
This platform uses AI to automatically determine user's complete application stack from his browser to the application, containers, infrastructure, and cloud. To start with Dynatrace, users just need to create an account, install the agent, and the platform will auto-discover the environment, and start performing.
Full stack monitoring provides full insights into customer experience, application performance management, and infrastructure monitoring—including servers, containers, and cloud—end-to-end with no blind spots. You will get deep, accurate, granular tracing of every single transaction made on your platform.
About New Relic
New Relic is one of the largest APM platforms on market with thousands of customers. It offers software and web analytics for startups, SMEs, and large corporations.
This platform offers SaaS Web & Mobile Application Monitoring for Ruby, PHP, .Net, Java, Python, Node.js, iOS, and Android with network monitoring capabilities. Thanks to it, developers can focus on coding, instead of solving issues with app's performance.
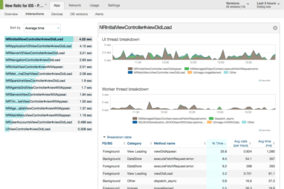
New Relic features a dashboard with real-time monitoring and deep diagnostic solutions. It is able to recognize when performance bottlenecks happen, where application stack and code problems exist, and how to repair them. There are also mobile monitoring tools offered for Android and iOS operating systems.
Features
API
Data Export
Data Import
External Integrations
Multi-User
Notifications
Malware Protection
Bug Tracking
Features
API
Data Export
Data Import
External Integrations
Multi-User
Notifications
Malware Protection
Bug Tracking
Summary
Business Insights
User Behavior Analytics
Business Transaction Monitoring
Application Topology Discovery
Root Cause Analysis
Real User Monitoring
Synthetic Monitoring
Mobile App Monitoring
Session Replay
RUM for SaaS Vendor Experience
Summary
Application Monitoring
Database Monitoring
Availability & Error Monitoring
Reports
Team Collaboration
Multi-Account Management
Security
Compliance Friendly
Configurable Security
Custom Dashboards
Pricing
Self-Service
$0.04
per host / hour
Included in plan:
Real User Monitoring
Full Stack Monitoring
Cloud Infrastructure Monitoring
Synthetic Monitoring
Code-level Visibility
Access to support portal
Max. host memory: 1.6 GB
Pricing
Lite
Free
Included in plan:
24-hr Data Retention
Forum/Online Support
Pro
$149.00
1 user(s) / month
Included in plan:
Transaction Traces
Cross Application Traces
SSO/SAML Supported
Silver or Gold Support
Database Monitoring: Metrics and SQL Analysis
Filterable Error Analytics and Traces
Service Maps
Deployment Tracking
SLA Reports
FAQs
What is this service generally used for?
This service is used for monitoring and managing the performance and availability of software applications.
Who are the main user groups of this service?
Main users of Dynatrace are SMEs and large enterprises.
What platforms does this service support?
Deployment: on-premises or as SaaS. Operating systems: Windows, Macintosh, Android, iOS.

 view 5 more
 view 5 more