
Vizzlo is an elegant data visualization tool that increases your productivity by creating designer-grade charts and diagrams in no time.
Vizzlo is an easy and elegant data visualization platform that increases productivity by providing users with extremely intuitive online tools to create designer-grade charts and diagrams in no time.
We are helping hundreds of thousands of users in more than 120 countries create marketing reports, financial forecasts, track progress, improve project management, and even timeline events. It is as easy to use, as importing your data, adding your corporate look if desired, and sharing it online. You can also choose to export your document as a high-quality PDF or PNG file.
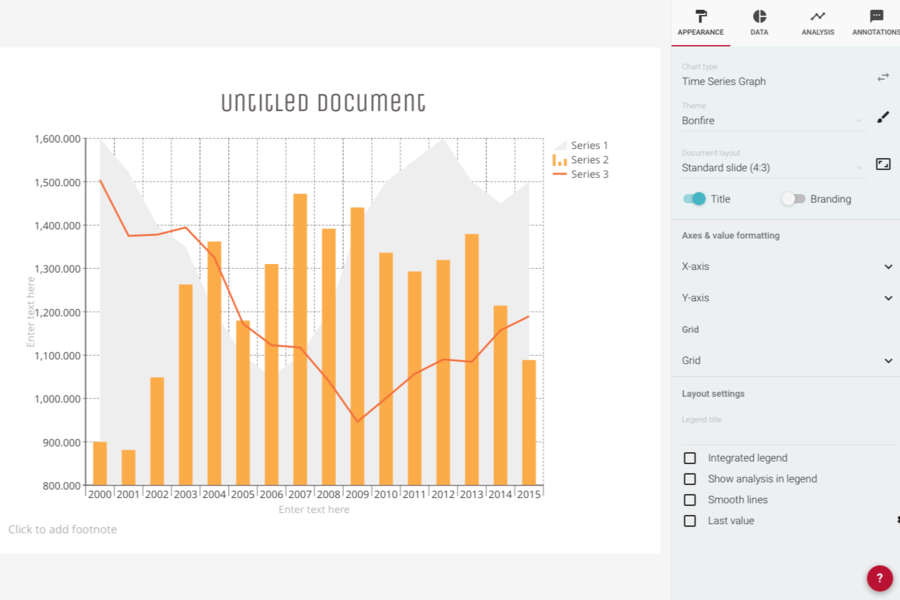
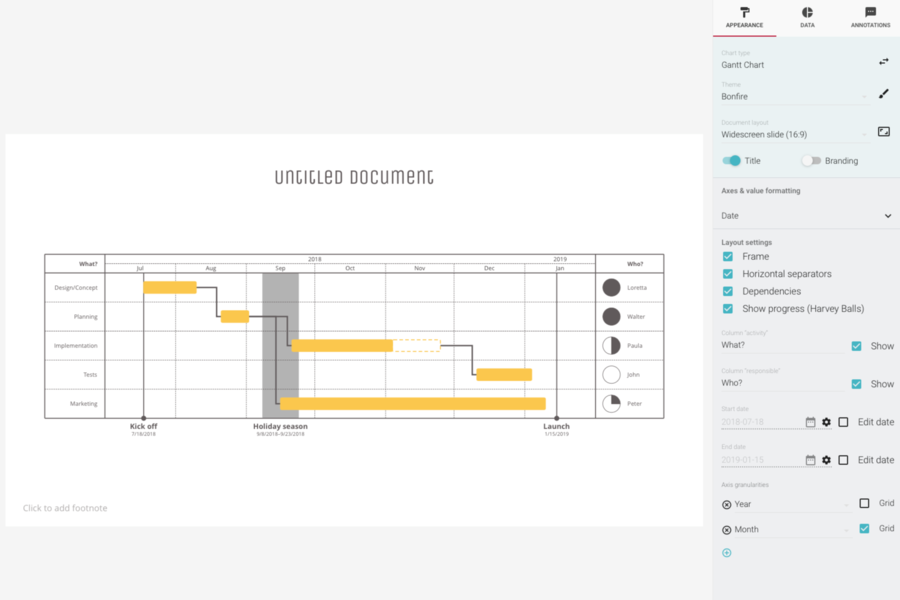
Vizzlo supports all data visualizations from complex graphs like the Gantt charts, Business model canvas', or the Waterfall chart, all the way to your popular Bar and Pie chart, adding the Vizzlo touch while offering customization options.
Collaborating is also very simple with Vizzlo since you can edit your work on your browser or directly in Powerpoint, plus share viewing and editing rights with your peers with the click of a button!
Adhering feedback into its development, Vizzlo is in constant growth and improvement to best tend to our customer’s needs. There is no more dynamic way to translate your ideas and information into an easy-to-read document for screens or paper!
Vizzlo currently scores 84/100 in the Data Visualization category. This is based on user satisfaction (86/100), press buzz (47/100), recent user trends (falling), and other relevant information on Vizzlo gathered from around the web.
| The score for this software has improved over the past month. What is this? |
100+ intelligent templates that automatically adjust to your data and ensure designer-grade results
No designer skills needed
Corporate design compliant
Data driven charts
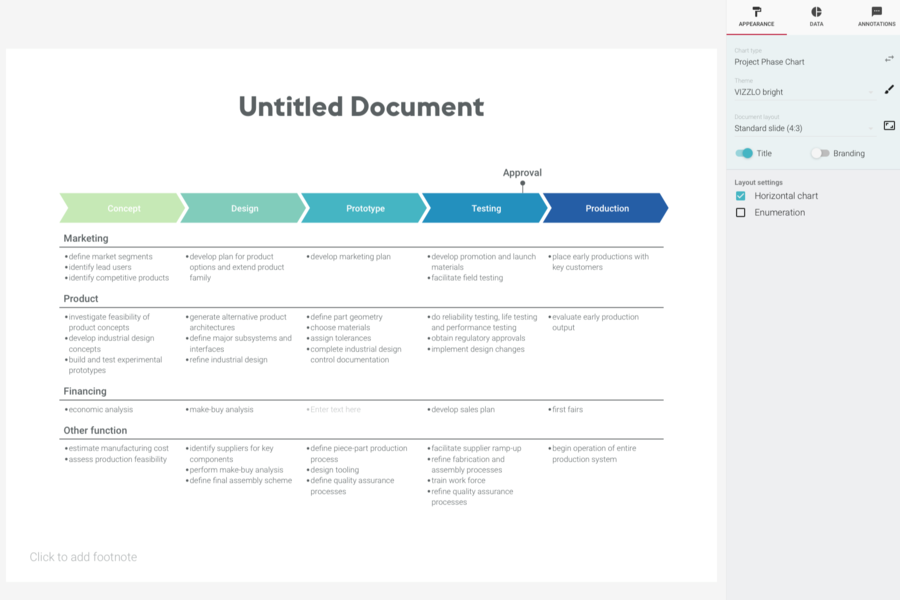
Financial charts and business frameworks
Project management charts
Microsoft PowerPoint and Google Slides integration
No installation needed
Free trial

Product recommendations, vendor rankings, market overview and tips on how to select Data Visualization software for business. Published in April 2024.
Data visualization software can be used to generate easily understandable visual representations of data based on key business metrics. These solutions enable users to create dashboards from their data in a simple manner by providing features such as drag-a...
FREE DOWNLOAD Data-Visualization-Software-Buyer-Guide-2018.pdfOn request.

It has a pretty website and has an attractive looking sales funnel to make you sign up for a free trial
After your trial runs out they charge you the whole year up front right away, despite the messaging that it is only about 11$ a month. Then they won't let you get out of the whole year and avoid any refunds
It has about 2 chart templates that are useful and not worth paying 100 dollars for