
Polly is a cloud-based, AI-enabled integrated biomedical data platform that standardizes and streamlines workflows for multi-omics experiments.
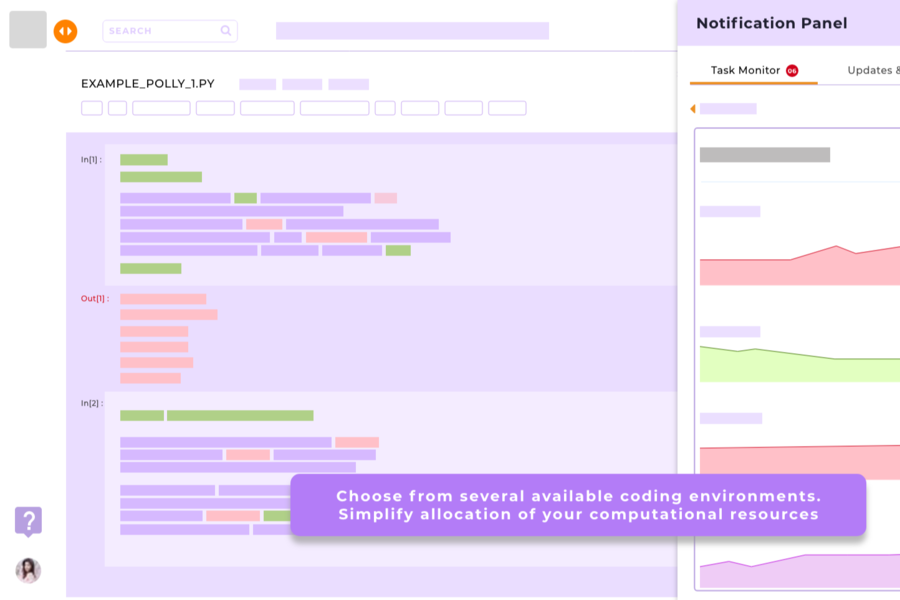
Polly is a cloud-based, AI-enabled integrated biomedical data platform that standardizes and streamlines workflows for multi-omics experiments. It enables R&D teams to use biomedical data and tools efficiently. Polly is a one-stop solution for bioinformatics with tools for data ingestion, processing, interpretation, and management. Polly is an AI-enabled platform with a user-friendly subscription-based model.
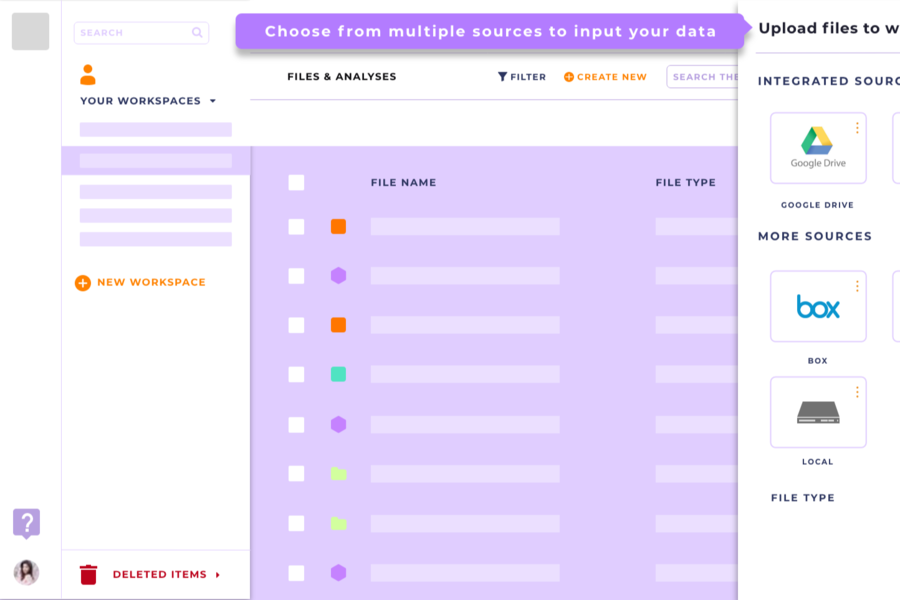
R&D teams use a combination of proprietary data generated in-house or in CROs, and data in public repositories. While there is a huge volume of data in public “data dumpster” repositories, it can be extremely difficult to find, query, and analyze. Polly’s algorithms and techniques help to get public data to an analysis-ready stage and streamline the processing and visualization through proprietary workflows. It is often through the interplay of these two types of data together that hypotheses get tested, and new insights are discovered. Polly is built to handle high-throughput data and is equipped to integrate more than 20 types of heterogeneous biomedical data and 1000’s of tools.
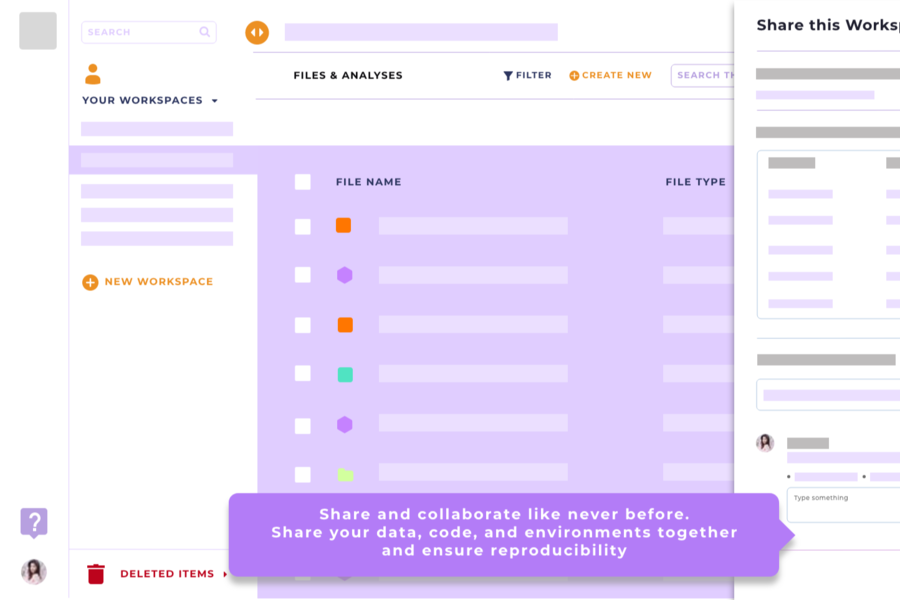
Polly is designed to have an offering to suit the needs of an entire R&D team by providing all the relevant “Lego” building blocks for their bioinformatics analyses across the pillars of data, tools, and reporting. Our customers can:
Furthermore, they can rapidly develop and deploy models to accelerate drug discovery by reducing the time taken to identify and validate drug targets. With on-demand high-value bioinformatics services at their disposal, they can also elucidate pathways and identify biomarkers, among other analyses.
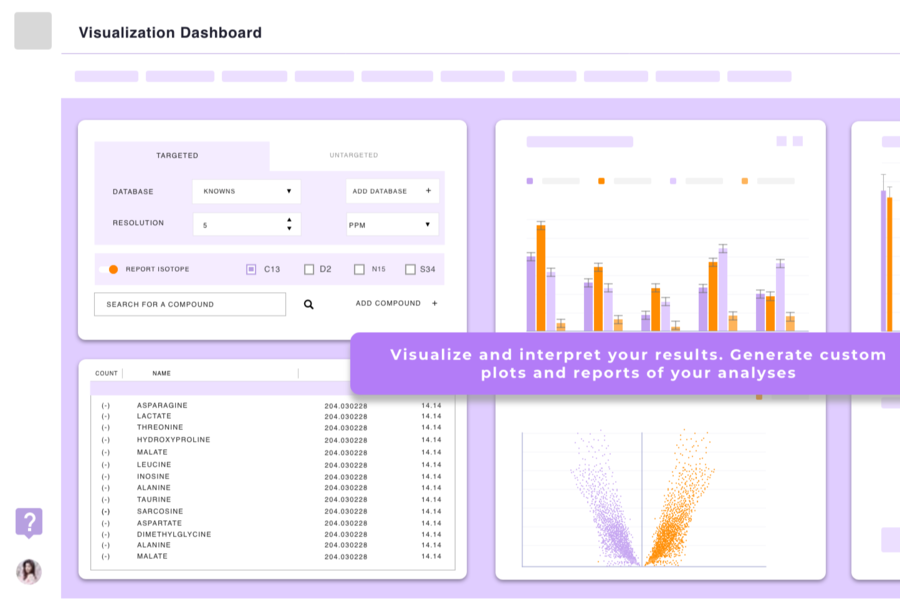
Polly currently scores 86/100 in the Data Visualization category. This is based on user satisfaction (90/100), press buzz (39/100), recent user trends (falling), and other relevant information on Polly gathered from around the web.
| The score for this software has improved over the past month. What is this? |

Product recommendations, vendor rankings, market overview and tips on how to select Data Visualization software for business. Published in April 2024.
Data visualization software can be used to generate easily understandable visual representations of data based on key business metrics. These solutions enable users to create dashboards from their data in a simple manner by providing features such as drag-a...
FREE DOWNLOAD Data-Visualization-Software-Buyer-Guide-2018.pdf