

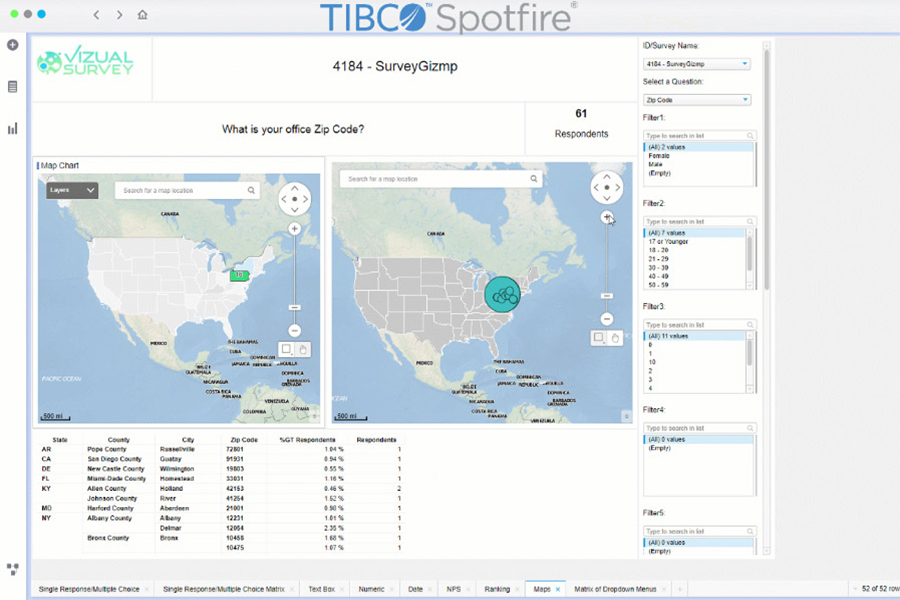
Use VizualSurvey to clean your survey data then connect it to one of our survey dashboard templates or build your own.
VizualSurvey Overview:
VizualSurvey software is for anyone – with or without analytics skills – who needs to create professional survey dashboards in the shortest possible time with the least possible hassle.
To do this VizualSurvey addresses one of the major problems with visualizing survey data: getting your data into the correct format.
Our user-friendly interface allows you to upload your survey data from any survey software and transform it into a format that will work perfectly with any data visualization software.
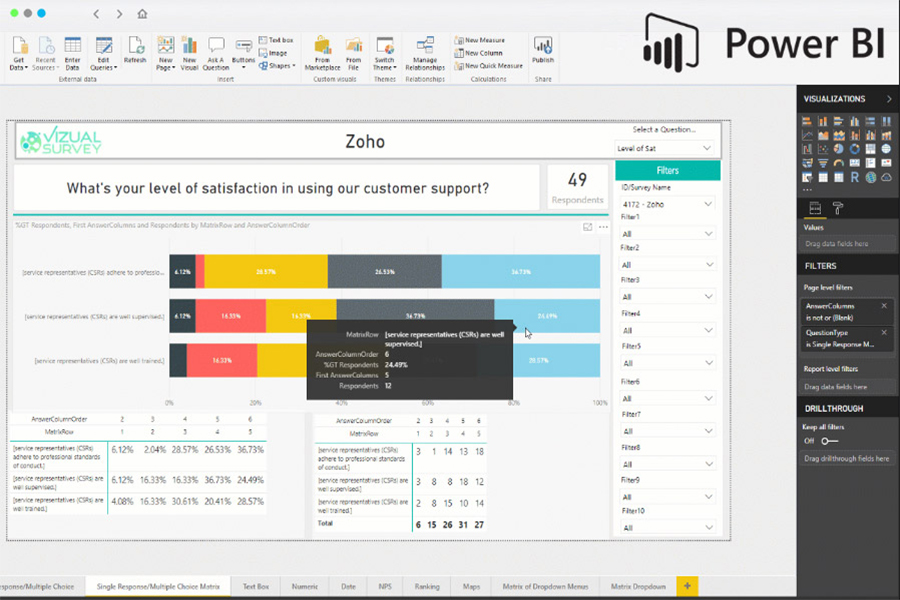
The transformation process optimizes your survey data so it’s perfectly compatible with our prebuilt survey dashboards in the top data visualization software. No data visualization experience necessary when you use our dashboard templates – just connect your new transformed data, and you’re ready to go! If you want to
How VizualSurvey Works:
VizualSurvey currently scores 67/100 in the Business Intelligence (BI) category. This is based on user satisfaction (88/100), press buzz (29/100), and other relevant information on VizualSurvey gathered from around the web.
| The score for this software has declined over the past month. What is this? |
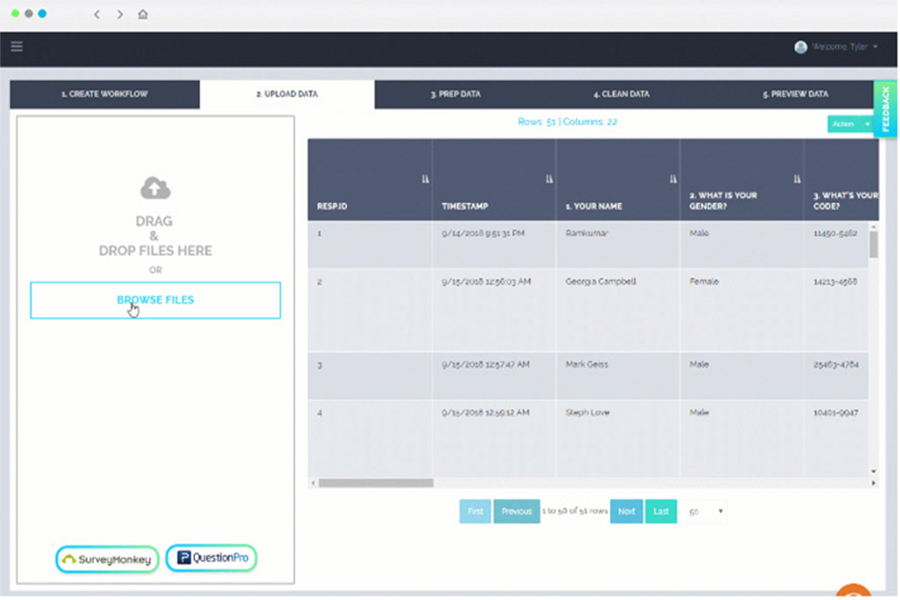
Connect or upload your survey data from any survey software
Easy-to-use interface with full tutorials
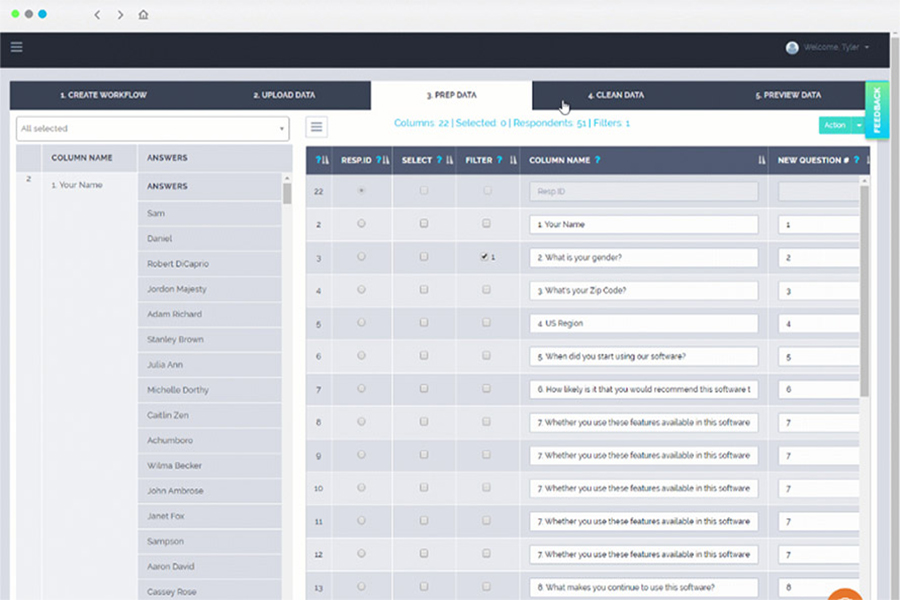
Prep and clean your survey data quickly
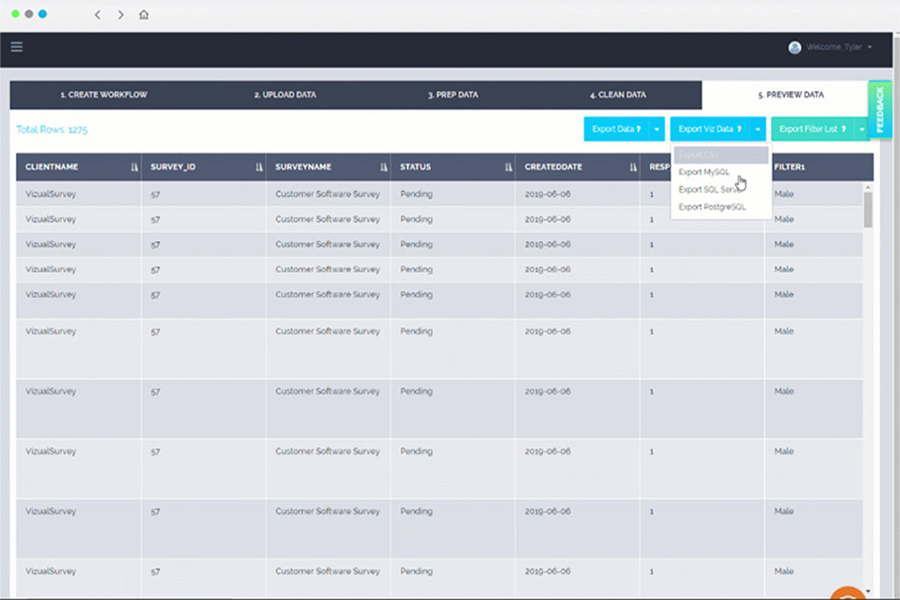
Export your survey data or multiple survey data at a time
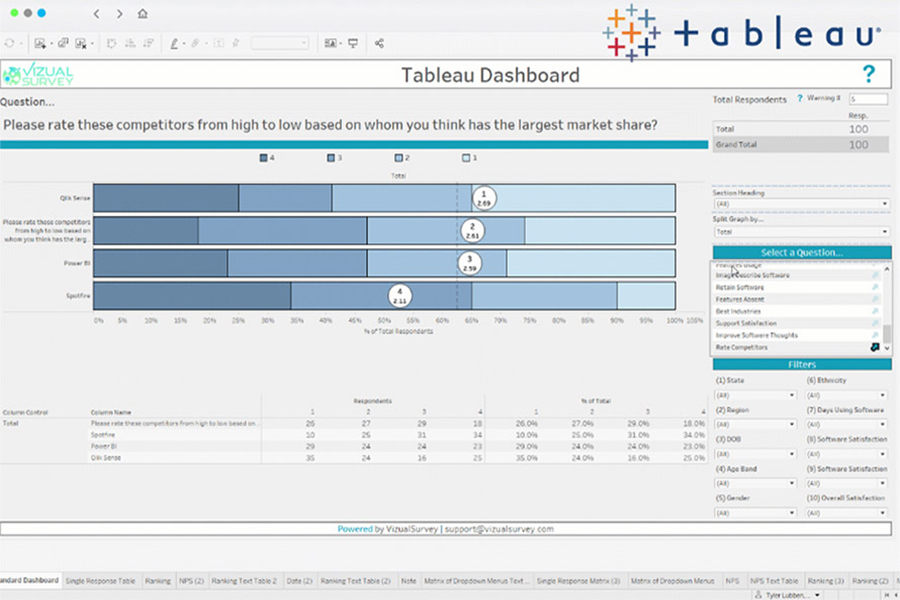
Connect it to one of our fully customizable survey dashboard templates
Data cleaning features specific to survey data
View all your surveys from any survey software in one dashboard
Export your survey data to a CSV-file
Export your data to your own MySQL, PostgreSQL or SQL Server database.

Product recommendations, vendor rankings, market overview and tips on how to select Business Intelligence (BI) software for business. Published in April 2024.
Every business gathers some raw data. Business intelligence (BI) is the process of converting that data into information the business can use for decisions making purposes. BI solutions provide you insights into business performance, commonly focused on mea...
FREE DOWNLOAD Business-Intelligence-(BI)-Software-Buyer-Guide-2018.pdfYes
VizualSurvey transform your survey data so that you can easily connect it to our dashboard templates or create your own dashboards in any data visualization tool.
Web app
VizualSurvey is for anyone who wants to quickly and easily analyze their survey data in a data visualization tool.
Survey data from Google Form, QuestionPro and SurveyMonkey can be connected via API.
Yes
