
BOXARR enables collaborative modelling, simulation, analysis of complex systems. Combines human-expertise, data and information sources to build a Digital Twin of businesses.
BOXARR enables people to collaboratively create Digital Twin models of their complex organizational challenges; capturing human knowledge & expertise through the intuitive medium of Boxes and Arrows.
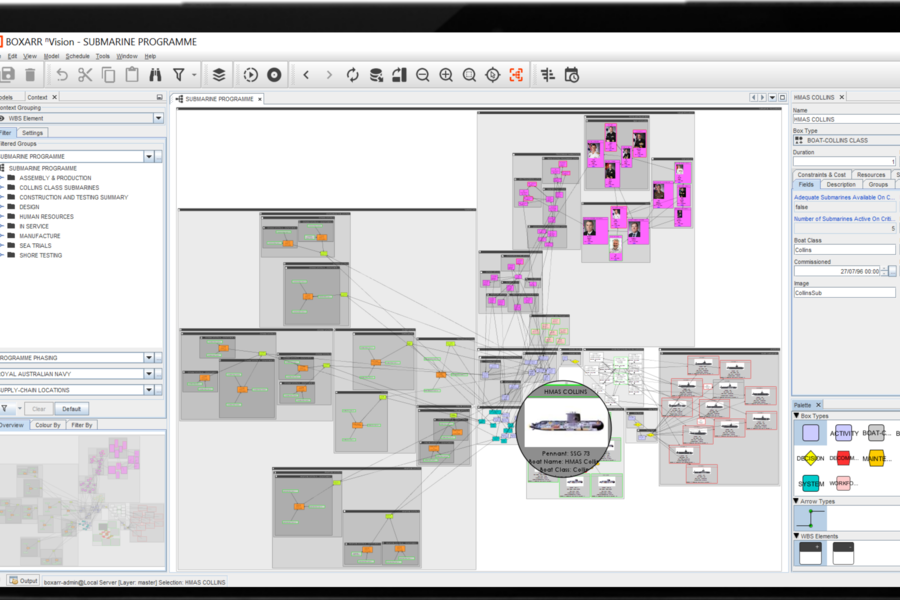
BOXARR models can scale-up to reflect the breadth, depth, and fidelity of inter-dependencies across ‘real world’ organizational systems – with the ability to incorporate hundreds of thousands of ‘Boxes’ and millions of data objects, leveraged from disparate data silos and information systems.
BOXARR models can be visualized, filtered, processed, and analyzed across multiple Contexts – for example: as a system-of-systems; by department; by location; by programme-phase; and as data tables/pivots, Gantt charts, and interactive dashboards. Multiple Layers can be overlaid to the baseline model to compare various what-if scenarios; enabling users to quickly identify and mitigate hidden risks and reveal further opportunities for optimization.
Users can effectively minimize risk by simulating and evaluating the propagated effects of proposed decisions/changes before they are implemented. Likewise, the diverse impacts of unforeseen events can be readily visualized to enable the timely deployment of collaborative remedial actions.
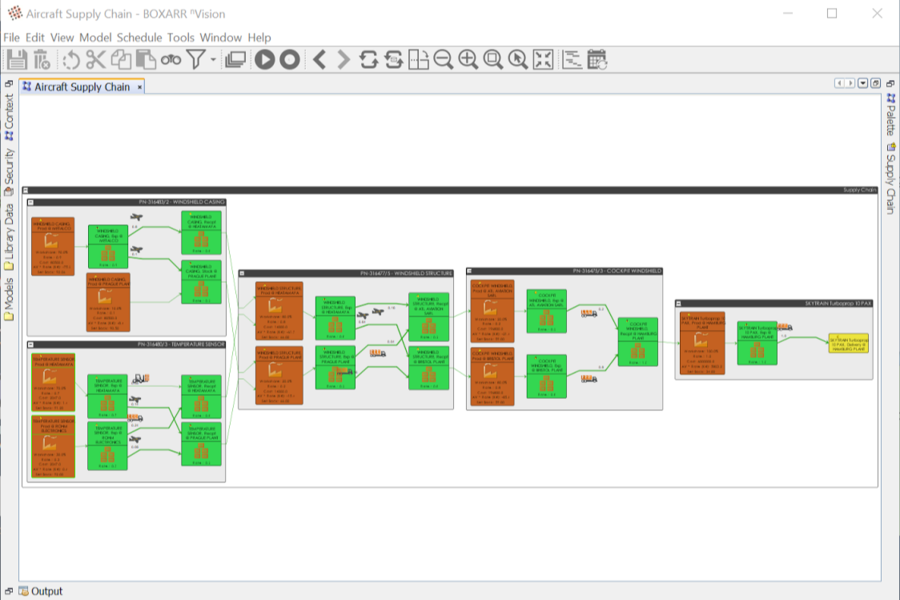
BOXARR’s proven paradigm can be applied and shared across a wide arrange of challenges such as: force design/integration; systems-engineering; programme/mission planning and sustainment; joint-operations; supply-chain resilience; operational & logistical process; and more.
BOXARR currently scores 58/100 in the Data Visualization category. This is based on press buzz (30/100), recent user trends (falling), and other relevant information on BOXARR gathered from around the web.
| The score for this software has stayed the same over the past month. What is this? |
Enable knowledge experts from various domains across the enterprise to collaboratively model and manage systems and challanges.
Create and manage models at real world scale, to accurately reflect the breadth, depth and fidelity of your systems and organisations.
Represent systems of inter-dependency within a variety of customisable & filterable visualisations and through multiple Contextual Lenses.
Leverage your existing information systems to apply attributes to objects within models via import/export or API systems-integration.
A powerful Functions Framework enables users to process data and conditionally format objects to produce both visual and data analytics.
Test models to identify and mitigate hidden risks; visualise the propagating impacts of change; and reveal opportunities to optimise.
Add Layers to the master baseline model to reflect and test alternative What-If scenarios - enabling effective decision support.
Share the value generated within your models with stakeholders and user-groups across your enterprise to transfer knowledge and optimise your operational performance.
Collaborate and federate with other BOXARR users across your Suppliers, Partners and Allies; visualising, analysing and managing the interdependencies between your organisations.

Product recommendations, vendor rankings, market overview and tips on how to select Data Visualization software for business. Published in April 2024.
Data visualization software can be used to generate easily understandable visual representations of data based on key business metrics. These solutions enable users to create dashboards from their data in a simple manner by providing features such as drag-a...
FREE DOWNLOAD Data-Visualization-Software-Buyer-Guide-2018.pdfNo, not yet.
No.
None at the moment.
Yes.
Building models of systems/processes in order to find efficiencies, save time, costs, improve quality, retain knowledge, resource planning, predictive analytics, and what-if scenarios.
Yes, there are guides and customer service available.
Consultancy firms, as well as companies of all sizes and enterprises.