
KeyLines is a JavaScript software development kit (SDK) for rapidly building applications to visualize and analyze complex connected data.
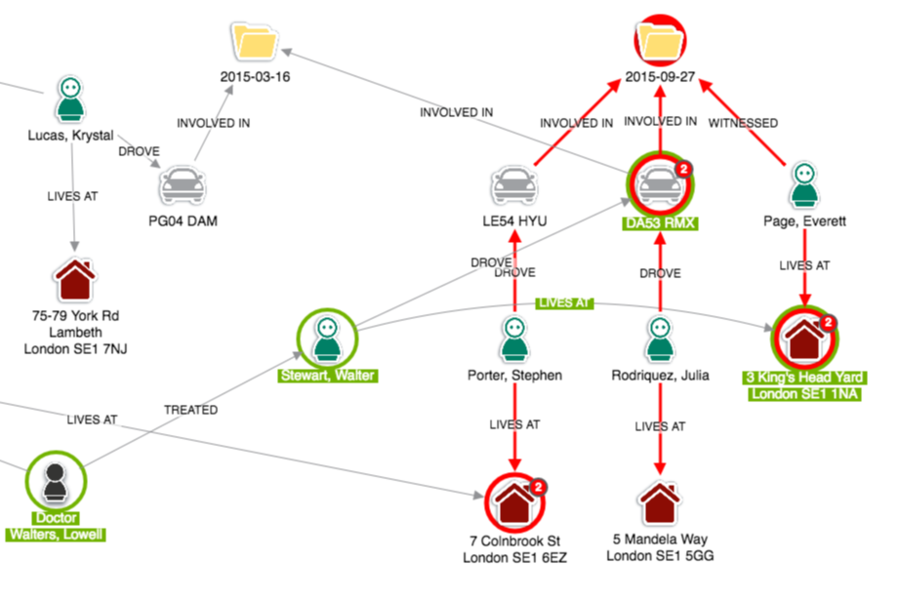
Connected data is everywhere. It’s in financial transactions, communications records, IT networks and beyond. The best way to understand it is to visualize it. Applications built with KeyLines offer new ways to join the dots in your data, revealing threats and hidden insight.
The KeyLines toolkit lets you design applications specifically for your users, your data and the questions you need to answer. It fits with any browser, device, server or database. It comes with step-by-step tutorials, interactive demos and a clearly documented API. Combined with our developer support, you’ll be uncovering graph insight in no time.
KeyLines makes it easy to build high-performance graph visualization applications that work anywhere. They harness HTML5 and WebGL graphics rendering and thoughtfully crafted code to give users a fast and insightful visualization experience.
KeyLines currently scores 76/100 in the Data Visualization category. This is based on press buzz (44/100), and other relevant information on KeyLines gathered from around the web.
| The score for this software has stayed the same over the past month. What is this? |
Customization
Compatibility
Automatic Layouts
Node Combining & Grouping
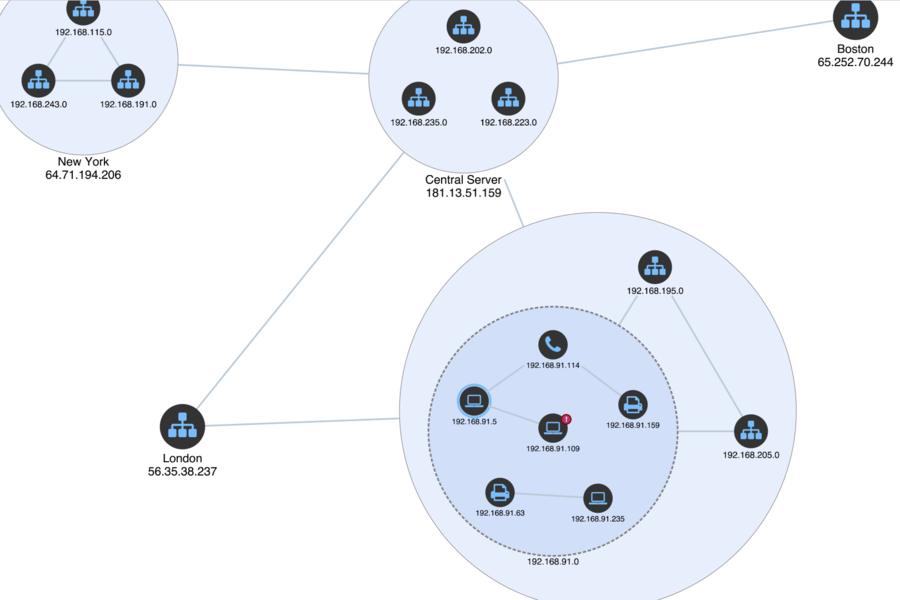
Network Filtering
Social Network Analysis
The Time Bar
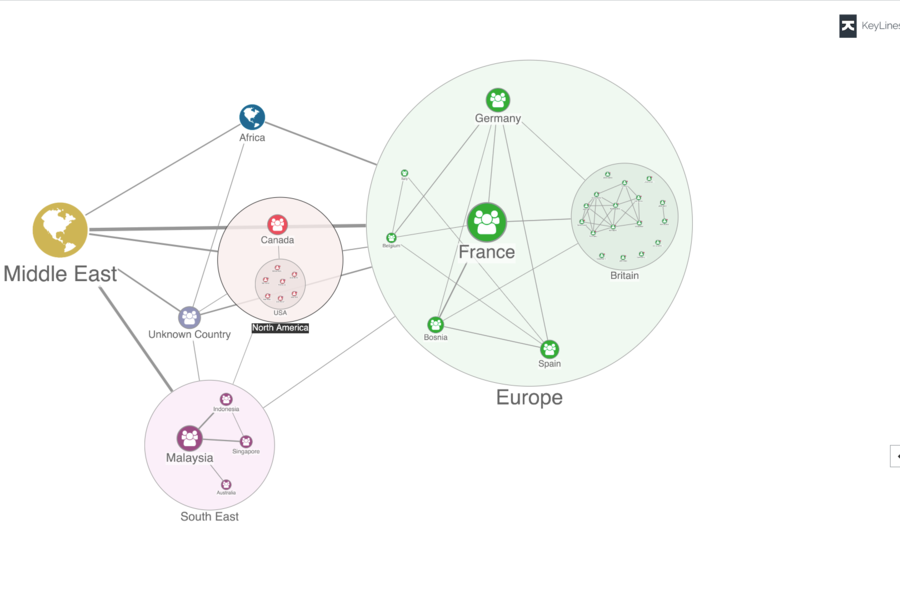
Geospatial Networks
WebGL and HTML5 Canvas Graphics Rendering

Product recommendations, vendor rankings, market overview and tips on how to select Data Visualization software for business. Published in April 2024.
Data visualization software can be used to generate easily understandable visual representations of data based on key business metrics. These solutions enable users to create dashboards from their data in a simple manner by providing features such as drag-a...
FREE DOWNLOAD Data-Visualization-Software-Buyer-Guide-2018.pdfSupport: Videos, Email Support, Phone Support.
No.
It is commonly used in tandem with data storage and querying applications.
Keylines is a web-based solution.
KeyLines provides a fully-documented API of functionality including real-time, dynamic and geospatial network support.
Integrations: neo4j, Datastax, IBM Graph, Titan, JanusGraph, ArangoDB, Elastic, OrientDB, Cayley, InfiniteGraph, Postgre SQL, React, AngularJS.
It is used as a Software Development Kit (SDK) for network visualization.
Cambridge-Intelligence works with hundreds of customers, including start-ups, Fortune 500 companies and national governments.